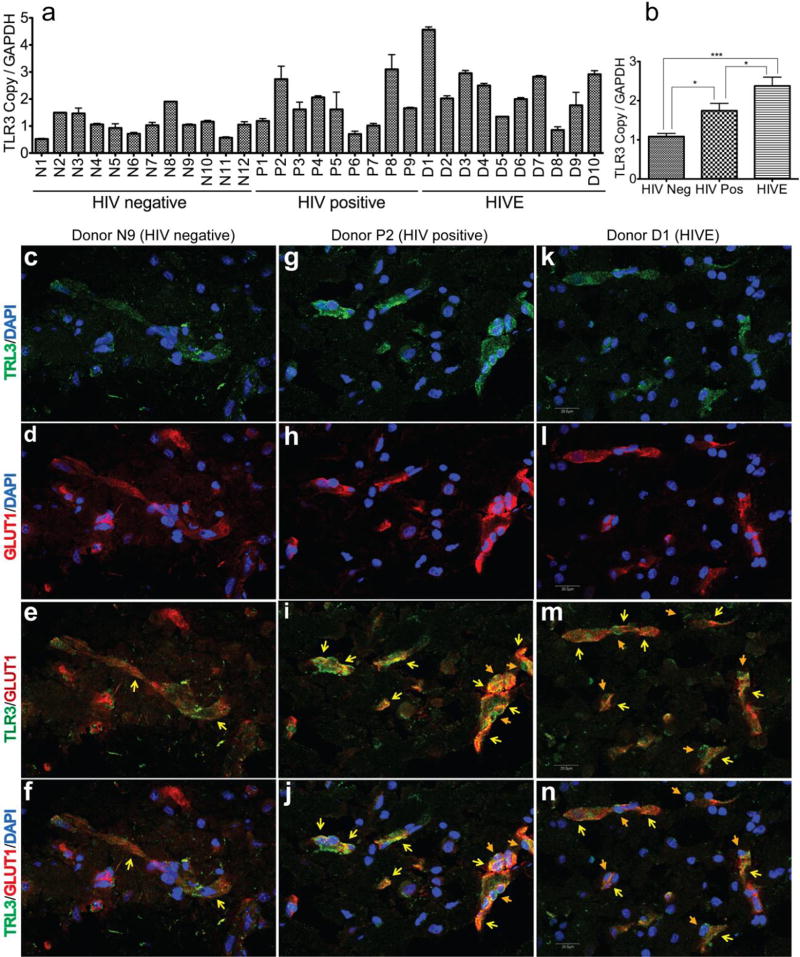
Fig. 3. Increased TLR3 expression in brain tissues and CNS blood vessels of HIV-1-infected humans.
(a, b): Quantitative real-time PCR show increased TLR3 mRNA in brain tissues of HIV-1-positive individuals (HIV pos, donors P1 to P9), and infected patients with HAND or HIVE (donors D1 to D10), compared to seronegative controls (HIV Neg, donors N1 to N12). *P<0.05, ***P<0.001. (c-n): Confocal microscopy of human brain tissues sections stained with monoclonal antibodies to TLR3 (green) and the endothelial glucose transporter-1 (GLUT1) (red). Images with (c, d, f, g, h, j, k, l, n) and without (e, i, m) DAPI staining shows TLR3 expression on blood vessels, including blood vessels tight junction strands (yellow arrows). For HIV+ and HIVE patients, data also shows TLR3 expression on mononuclear phagocytes ingressing across the blood-brain barrier (orange arrows). Scale bar for all panels: 20 µM.

