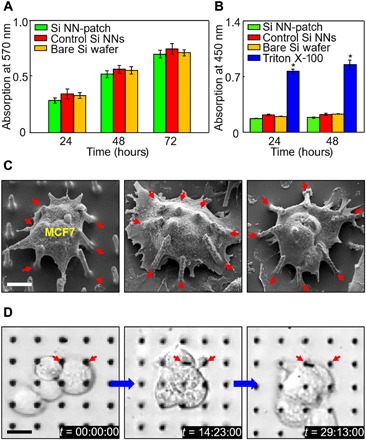
Fig. 3. Basic characterizations of Si NN-patch.

(A) Results of MTT assay in the cytotoxicity tests of HDF cells interfaced with the Si NN-patch (green) and control Si NNs on a Si wafer (red) and a bare Si wafer (yellow). Error bar represents the SD of three replicates. (B) Results of LDH assay in the invasiveness tests of HDF cells for 2 days. Triton X-100 is used as a positive control (blue). Error bar represents the SD of three replicates. (C) SEM images of MCF7 cells on a representative Si NN-patch at 24 hours after nanoinjection. Scale bar, 10 μm. Arrows highlight the deformed Si NNs by cell deformations. (D) Time-lapsed live differential interference contrast (DIC) images of HDF cells that interacted with Si NNs at the bottom. Scale bar, 10 μm.
