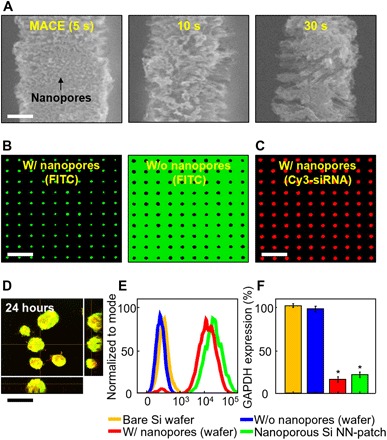
Fig. 4. Formation of nanoscale surface pores and intracellular nanoinjection of siRNA.

(A) SEM images of nanopores formed on the surface of Si NNs at different treatment times of MACE. Scale bar, 250 nm. (B) Confocal microscopy images of Si NNs with (left) and without (right) nanopores on the surface by using a green fluorescence dye. Scale bar, 15 μm. (C) Confocal microscopy image of nanoporous Si NNs loaded with Cy3-siRNAs (red). Scale bar, 15 μm. (D) Confocal microscopy image of GFP-MCF7 cells at 24 hours after nanoinjection of Cy3-siRNAs. Scale bar, 15 μm. (E) Results of flow cytometry (FACS) analysis for SKOV3 cells at 48 hours after nanoinjection of Cy3-siRNAs by using the nanoporous Si NN-patch (green) and control Si NNs on a bulk Si wafer with (red) and without (blue) nanopores on the surface and a bare Si wafer (yellow). (F) Corresponding results of GAPDH analysis for the SKOV3 cells. Error bar represents the SD of three replicates.
