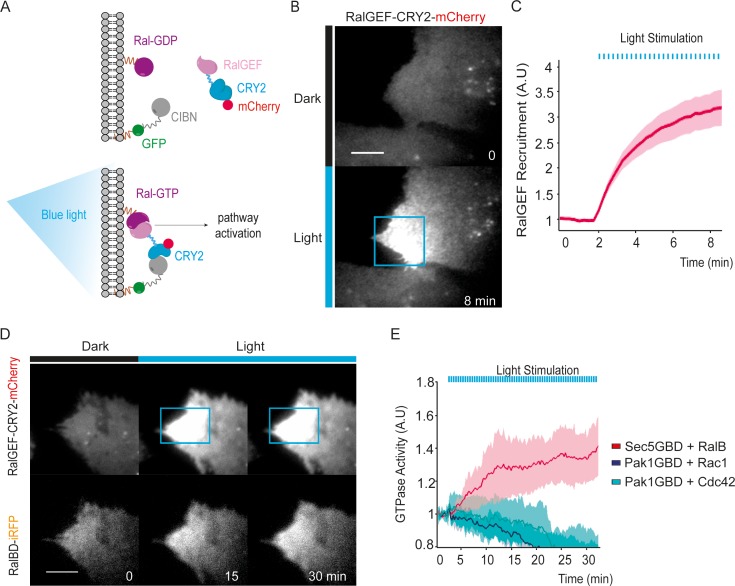
Figure 1. Optogenetic control of Ral activation.
(A) The OptoRal strategy. Upon blue light stimulation the RalGEF domain of RGL2, fused to CRY2, is recruited to the plasma membrane following the interaction between CRY2 and CIBN, which is targeted to the plasma membrane by a CAAX prenylation motif. mCherry and GFP fluorescent proteins were used to monitor expression and localization of RalGEF-CRY2 and CIBN, respectively. After recruitment, the RalGEF induces activation of endogenous Ral. (B) Representative RalGEF-CRY2-mCherry recruitment. The fluorescent RalGEF-CRY2-mCherry fusion protein was imaged by TIRF microscopy before illumination (dark) and 8 min after blue light stimulation inside the blue square area (100 ms pulses every 15 s). Scale bar, 10 μm. See Video 1 for the entire sequence. (C) Quantification of RalGEF-CRY2-mCherry recruitment. Average time course of the fold increase of mCherry fluorescence, that is RalGEF recruitment, inside the illuminated square area, is calculated from n = 20 cells from three independent experiments. Lines represent the mean, shaded regions represent the standard deviation (SD). (D) Representative Ral activation. The fluorescent RalGEF-CRY2-mCherry and Sec5GBD-iRFP (reporter of Ral activity) fusion proteins were simultaneously imaged by TIRF microscopy. Scale bar, 10 μm. See Video 2 for the entire sequence. (E) Light activates RalB, but not Rac1 or Cdc42. OptoRal cells were transiently transfected to express: Sec5GBD-iRFP (reporter of Ral activity) with GFP-RalB (red line), Pak1GBD-iRFP (reporter of Rac1/Cdc42 activity) with GFP-Rac1 (blue line) or Pak1GBD-iRFP with GFP-Cdc42, respectively (light blue line). Average time course of the fold increase of iRFP fluorescence, that is Ral or Rac1/Cdc42 activities, inside the illuminated square area, is calculated from n = 6 cells per condition from three independent experiments. Lines represent the mean, shaded regions represent the standard deviation (SD).


