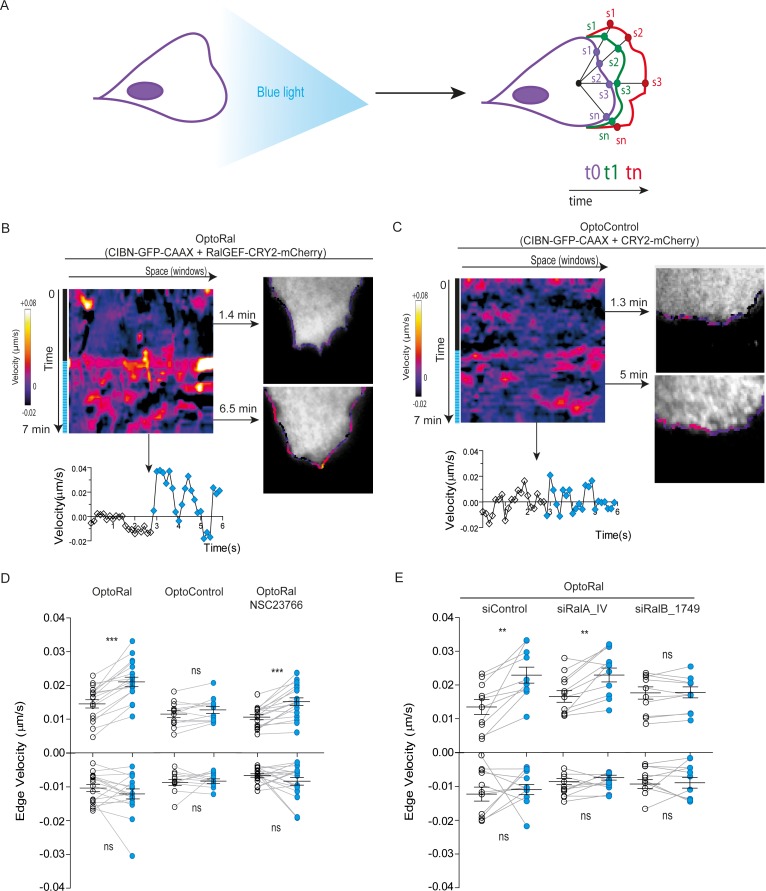
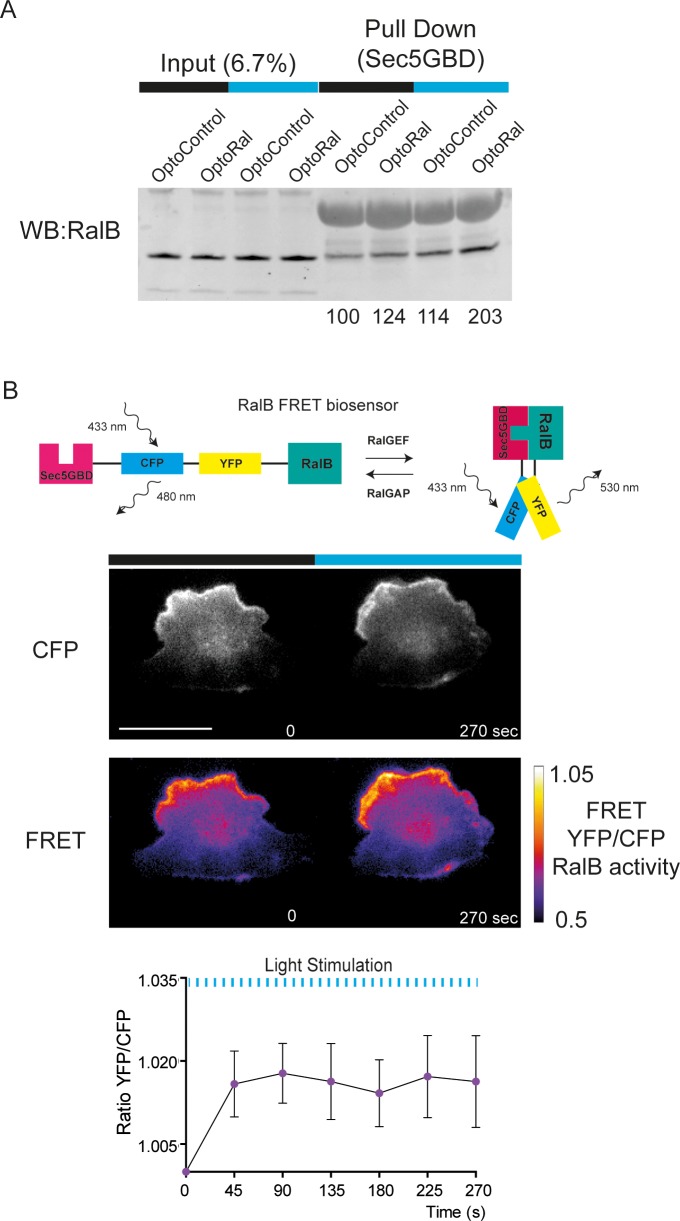
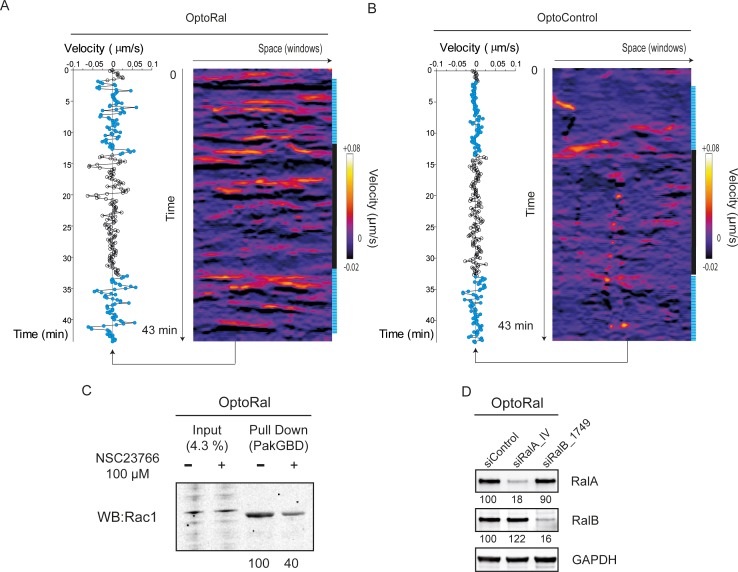
Figure 2. Local Ral activation induces protrusiveness.
(A) Cell edge dynamics inside the illuminated area were measured using an automated method. (B) Edge dynamics velocity map of a representative OptoRal cell before and after illumination (dotted blue line). See Video 3 for the entire sequence. The color-coded map shows the velocity measurements for each sampled edge window (space, horizontal axis) and for each time point (time, vertical axis). Positive velocities (i.e. protrusion) are represented as warm color, negative velocities (i.e. retraction) as cold colors. As example of velocity profile over time, the velocity measurements are shown for a selected point in space (window 71) in the lower panel; the stimulation of edge velocity is visible immediately after light illumination. As examples of velocity profiles over the space dimension, the velocity measurements are shown in the right panels using the color-code along the cell edge for two selected time points, 1.4 min and 6.5 min, dark and light conditions, respectively. (C) Edge dynamics velocity map of a representative OptoControl cell before and after illumination. See Video 4 for the entire sequence. The velocity profiles over time (window 77, lower panel) or over space (1.3 min and 5 min, right panels) show that illumination did not induce any change of edge velocity. (D) Quantification of edge velocities before and after illumination. Positive velocities (i.e. protrusion) and negative velocities (i.e. retraction) are analysed separately. Each white dot represents the mean of all velocity measurements (all time and space points) before illumination. Each blue dot represents the mean of all velocity measurements (all time and space points) after illumination. Measurements from a same cell are connected by lines. Illumination stimulates positive edge velocities in OptoRal cells (left) but not in OptoControl cells (centre). Inhibition of Rac with NSC23766 (100 µM, treatment started 1 hr before experiment) did not impair stimulation by light of positive edge velocities in OptoRal cells (right). Bars represent mean of n = 18 cells per condition ±SEM from three independent experiments. *** indicates p<0.001, ** indicates p<0.01 and ns indicates not-significant, using Wilcoxon signed-rank test for paired measurements (same cell pre- and post-illumination). There was no significant difference in the delta velocities pre- and post-illumination when comparing presence and absence of the NSC23766 inhibitor (using Student t-test, not shown). There was no significant difference in the pre-illumination edge velocities when comparing OptoRal and OptoControl cells (using Student t-test, not shown). (E) RalB depletion, but not RalA depletion, impairs stimulation of positive edge velocities in OptoRal cells. OptoRal cells were transfected with the indicated siRNAs and analysed as in panel D. n = 10–11 cells per condition.


