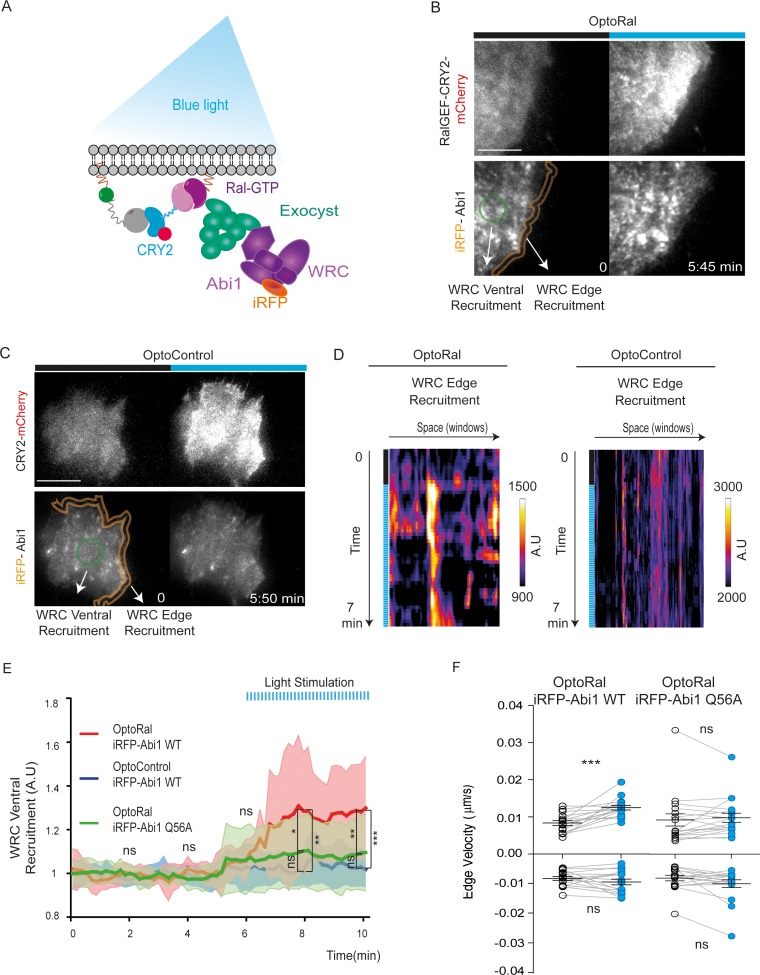
Figure 3. Local Ral activation induces WRC complex recruitment at the edge and ventral plasmamembrane via the exocyst.
(A) Working model. Upon Ral activation, exocyst is assembled and recruited at the plasma membrane, functioning as transporter for the WRC complex. The model was tested by monitoring the recruitment of WRC by TIRF microscopy using a fluorescent-tagged Abi1 subunit of WRC (iRFP-Abi1). (B) Representative iRFP-Abi1 recruitment (reporter of WRC localization) in OptoRal cells. The fluorescent RalGEF-CRY2-mCherry and iRFP-Abi1 fusion proteins were simultaneously imaged with TIRF microscopy before and 7 min after blue light stimulation. Scale bar, 10 μm. See Video 5 for the entire sequence. The variations of iRFP fluorescence were measured both at the ventral compartment (green circle) and at the leading edge (orange lines) of the cells. (C) Representative absence of light-dependent iRFP-Abi1 recruitment in OptoControl cells. Scale bar, 10 μm. See Video 6. There is an increase of mCherry but not of iRFP fluorescence after illumination. (D) Color-coded maps show the WRC edge recruitment in the OptoRal cell of panel B and in the OptoControl cell of panel C, calculated across a band with a width of 1.12 µm, before and after illumination, for each sampled edge window (space, horizontal axis) and for each time point (time, vertical axis). In the OptoRal cell (left), changes to warmer colors after illumination indicate increased WRC recruitment. In the OptoControl cell (right), there are no changes of WRC edge recruitment after illumination. (E) Quantification of ventral iRFP-Abi1 recruitment: comparison of OptoRal iRFP-Abi1 wild-type (WT), OptoControl iRFP-Abi1 wild-type (WT), and OptoRal iRFP-Abi1Q56A cells. Average time course of the fold increase of iRFP fluorescence, that is WRC recruitment, is calculated from n = 15 cells per condition from four independent experiments. Lines represent the mean, shaded regions represent the standard deviation (SD). Statistical comparison of the three curves was done using Student t-test at 2, 4, 6, 8, 10 min time points: *p<0.05, **p<0.01, ***, p<0.001, ns not-significant. Only the OptoRal iRFP-Abi1 wild-type curve diverges after light stimulation (at 6 min). (F) Quantification of edge velocities before and after illumination: comparison Abi1 wild-type (WT) versus Abi1Q56A in OptoRal cells. See legend Figure 2D for details. Illumination stimulates positive edge velocities in OptoRal cells expressing Abi1 WT (left) but not in OptoRal cells expressing Abi1Q56A (right). Bars represent mean of n = 15 cells per condition ±SEM from three independent experiments. *** indicates p<0.001 and ns indicates not-significant, using Wilcoxon signed-rank test for paired measurements (same cell pre- and post-illumination).


