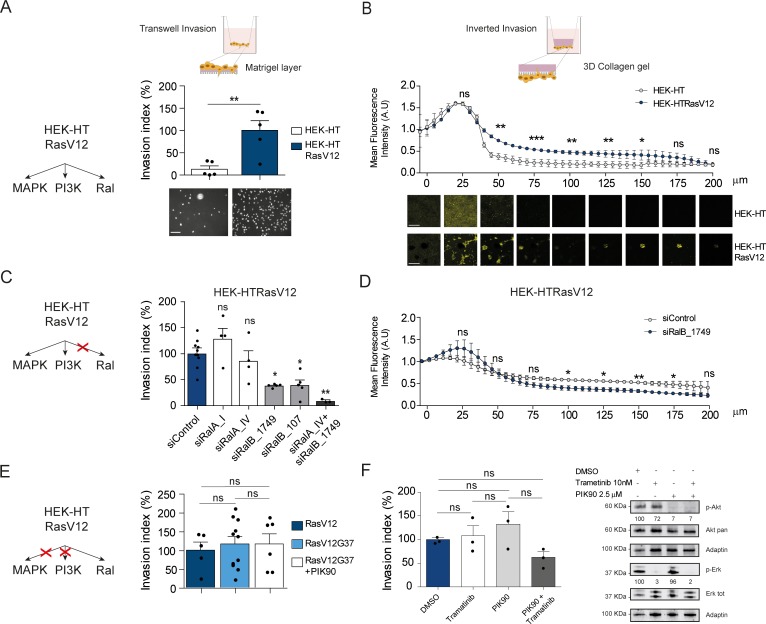
Figure 5. Ras-driven invasion requires RalB, rather than MAPK and PI3K.
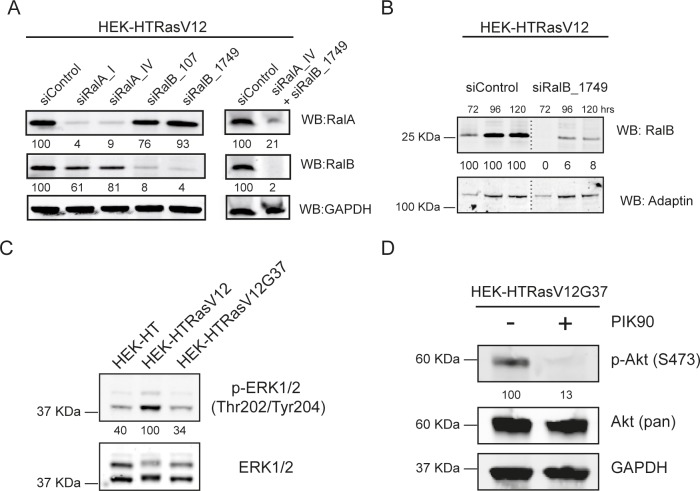
(A) Comparison of invasive capability of HEK-HT and HEK-HT-H-RasV12 cells through a thin matrigel layer using Transwell invasion assay (6 hr). Representative images of invading cells stained with DAPI are shown below the graph. Scale bar, 50 µm. Graph shows the mean ±SEM. Each dot represents one experiment. For statistics Student t-test was used. (B) Comparison of invasive capability of HEK-HT and HEK-HT-HRasV12 cells through a 3D bovine collagen gel (2.3 mg/ml) using Inverted invasion assay (4 days). Cells were live stained with CellTrace. Invasion was quantified as mean fluorescence of confocal fields acquired every 5 µm starting from below the porous membrane till 200 µm distance inside the gel. Graph shows the mean ±SD of measurements in duplicate from three experiments. Representative images are shown below the graph. Scale bar, 250 µm. Statistical comparison of the curves was done using Student t-test at every 25 µm. (C) RalB but not RalA is required for HEK-HTRasV12 invasion through a matrigel layer (Transwell invasion assay). Cells were transfected with the indicated siRNAs. For statistics one-way ANOVA test was used. (D) RalB is required for HEK-HTRasV12 invasion through a 3D collagen gel (Inverted invasion assay). Invasion was quantified as in panel B. (E) Comparison of invasive capability of HEK-HT-H-RasV12, HEK-HT-H-RasV12G37 and PIK90-treated HEK-HT-H-RasV12G37 cell lines using Transwell invasion assay. The combination of the additional G37 mutation and treatment with the PI3K inhibitor PIK90 (10 µM, treatment started 1 hr before Transwell invasion assay and maintained during the 6 hr invasion) impairs RasV12-dependent MAPK and PI3K hyperactivation, conserving only the activation of Ral pathway. For statistics one-way ANOVA test was used. (F) Comparison of invasive capability of HEK-HT-H-RasV12 cells treated with DMSO, with the MEK inhibitor Trametinib (10 nM), with the PI3K inhibitor PIK90 (2.5 μM), or with both Trametinib and PIK90. Treatments were started 1 hr before Transwell invasion assay and maintained during the 6 hr invasion. Cell lysates were prepared at 1 hr post-treatment. On the right, representative western blots for total Akt and phospho-Akt (Ser437), and for total Erk and phospho-Erk (Thr202/Tyr204), show the efficient pharmacological blockage of MAPK and PI3K pathways. Quantifications of Akt and Erk phosphorylation, calculated as p-Akt/total Akt or p-Erk/total Erk ratios, and normalized for HEK-HT-HRasV12 without drugs, are shown below the WBs. For statistics one-way ANOVA test was used. *p<0.05, **p<0.01, ***p<0.001, ns not-significant.


