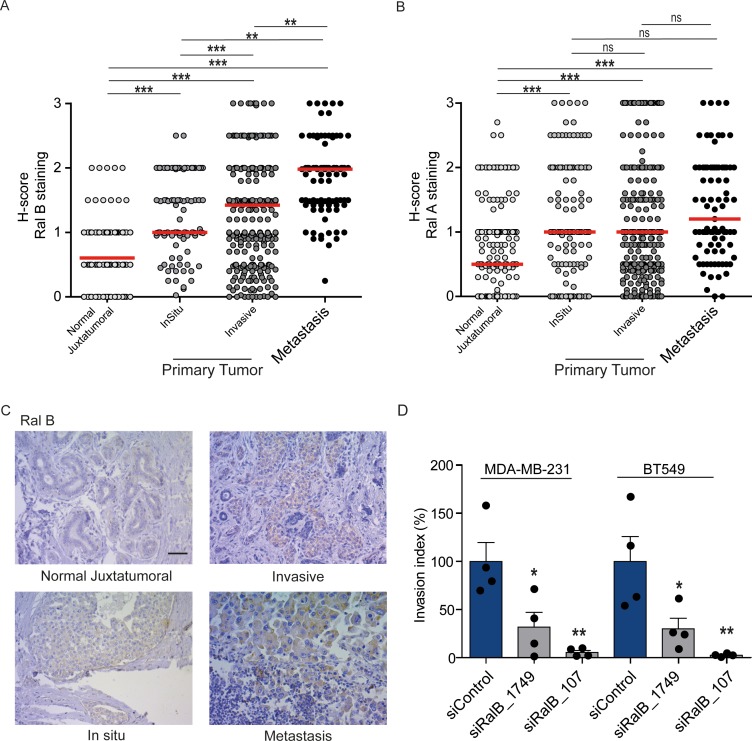
Figure 7. Expression of Ral proteins in human breast cancers. Role of RalB in breast cancer invasion.
(A) Quantitative analysis of RalB protein level in patient samples of normal juxtatumural tissue (n = 298), in situ carcinoma (n = 101), invasive ductal carcinoma (n = 439) and lymph node metastasis (n = 91). Since none of the data sets passed the Shapiro-Wilk normality test, the median H-scores are displayed. Wilcoxon signed-rank tests were performed on paired (i.e. from same patient) data points: n = 73 for normal versus in situ, n = 290 for normal versus invasive, n = 63 for normal versus metastasis, n = 99 for in situ versus invasive, n = 29 for in situ versus metastasis, n = 85 for invasive versus metastasis. *p<0.05, **p<0.01, ***p<0.001, ns not-significant. (B) Quantitative analysis of RalA protein level in patient samples of normal juxtatumural tissue (n = 371), in situ carcinoma (n = 144), invasive ductal carcinoma (n = 462) and lymph node metastasis (n = 87). Since none of the data sets passed the Shapiro-Wilk normality test, the median H-scores are displayed. Wilcoxon signed-rank tests were performed on paired (i.e. from same patient) data points: n = 129 for normal versus in situ, n = 368 for normal versus invasive, n = 69 for normal versus metastasis, n = 142 for in situ versus invasive, n = 39 for in situ versus metastasis, n = 83 for invasive versus metastasis. *p<0.05, **p<0.01, ***p<0.001, ns not-significant. (C) Representative RalB immunostaining in the different breast cancer compartments. Scale bar, 250 µm. (D) Invasion of human breast cancer cells requires RalB, regardless of Ras mutational status. MDA-MB-231 cells (carrying the KRasG13D mutation) and BT549 cells (Ras wild-type) were transfected with the indicated siRNAs and subjected to Transwell invasion assay. Graph shows the mean ±SEM. Each dot represents one experiment. For statistics one-way ANOVA test was used. *p<0.05, **p<0.01, ***p<0.001. ns not-significant. Legends for figure supplements.


