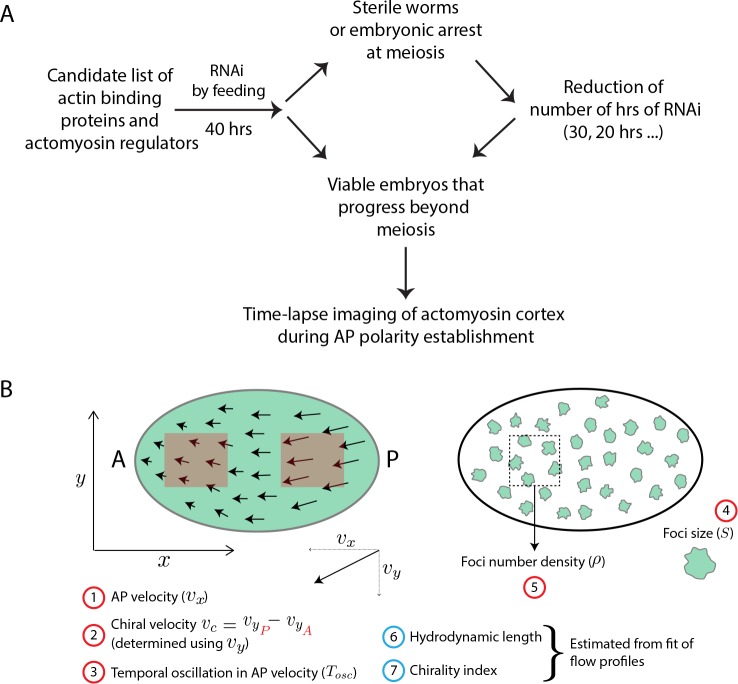
Figure 1. Screen strategy.
(A) Flow chart describes strategy undertaken to perform candidate RNAi screen of actin binding proteins and actomyosin regulators. Time-lapse images were then used to determine flow properties of the cortex. (B) Schematic of a 1-cell embryo indicating the quantities measured (numbers in red circle) and estimated (numbers in blue circle). Left - 1-cell embryo, where arrows indicate flow velocities and arrow lengths signify magnitude. A, anterior and P, posterior of the embryo; x-axis is along the long-axis of the embryo and the y-axis orthogonal to it. Red boxes within embryo indicate analysis regions in the posterior and anterior. Right - 1-cell embryo with myosin foci (green blobs).

