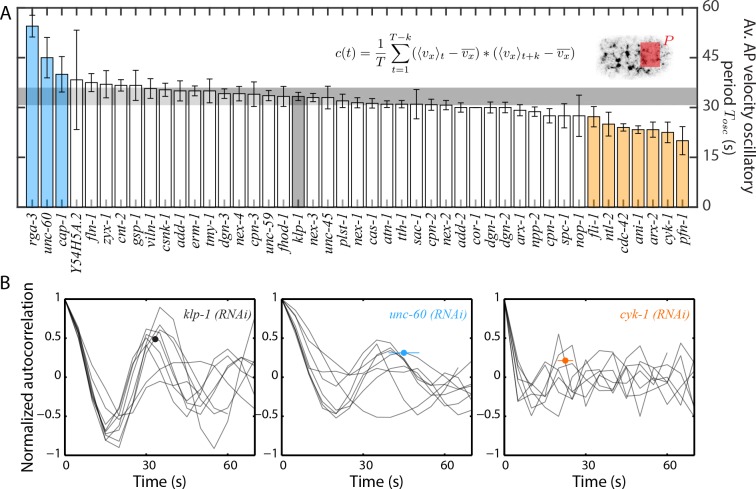
Figure 3. Quantification of pulsatile period of cortical flow.
(A) Comparison of mean period of pulsatile AP velocity, , in the posterior of the embryo. Shaded area in the inset represents the region over which the spatial average of velocity was performed in each time frame. The formula for the autocorrelation function is indicated, where is total analysis time of cortical flow and is increment (see Materials and methods). Error bars, SEM; gray bar, negative control, klp-1 (RNAi) condition; gray horizontal bar, error of the mean with 95% confidence for klp-1 (RNAi); cyan, beige bars, significantly different knockdowns with 95% confidence (Wilcoxon rank sum test). (B) Normalized autocorrelation decay curves from individual embryos (thin black lines) for the negative control, klp-1 (RNAi), cyk-1 (RNAi) and unc-60 (RNAi). Circular markers represent mean of the periods determined from individual embryos, with error bars representing SEM. See Supplementary file for number of independent embryo samples in each RNAi condition.

