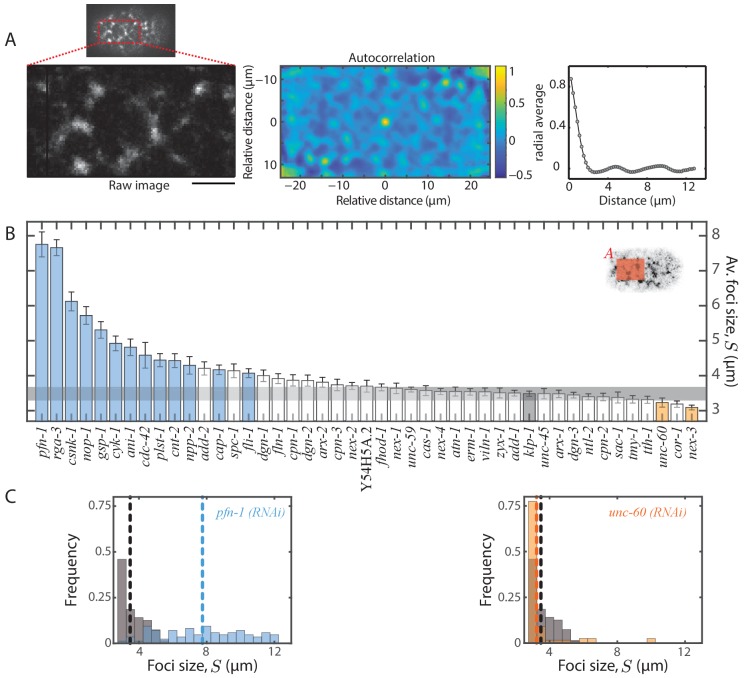
Figure 4. Quantification of myosin foci size.
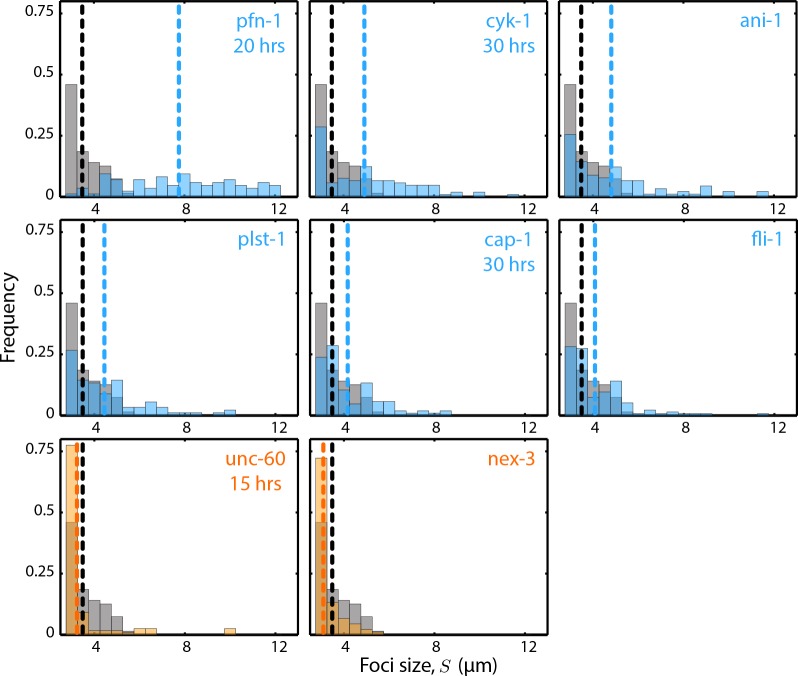
(A) Representative 2D myosin fluorescence intensity autocorrelation function as a heat map (middle) for the anterior region (left) of a single frame during cortical flow from a klp-1 (RNAi) embryo. Scale bar, 5 µm. Right - radial average of the autocorrelation function. (B) Comparison of mean foci size, . Error bars, SEM; gray bar, negative control, klp-1 (RNAi) condition; gray horizontal bar, error of the mean with 99% confidence for klp-1 (RNAi); cyan, beige bars, significantly different knockdowns with 99% confidence (Wilcoxon rank sum test). Shaded area in the inset represents the region in which the fluorescence intensity autocorrelation was performed in each frame. (C) Representative histograms of determined over time during the cortical flow period. Gray histograms, klp-1 (RNAi) condition; dashed lines, mean foci size. See Figure 4—figure supplement 1 for histograms of significantly different ABPs. See Supplementary file for number of independent embryo samples in each RNAi condition.


