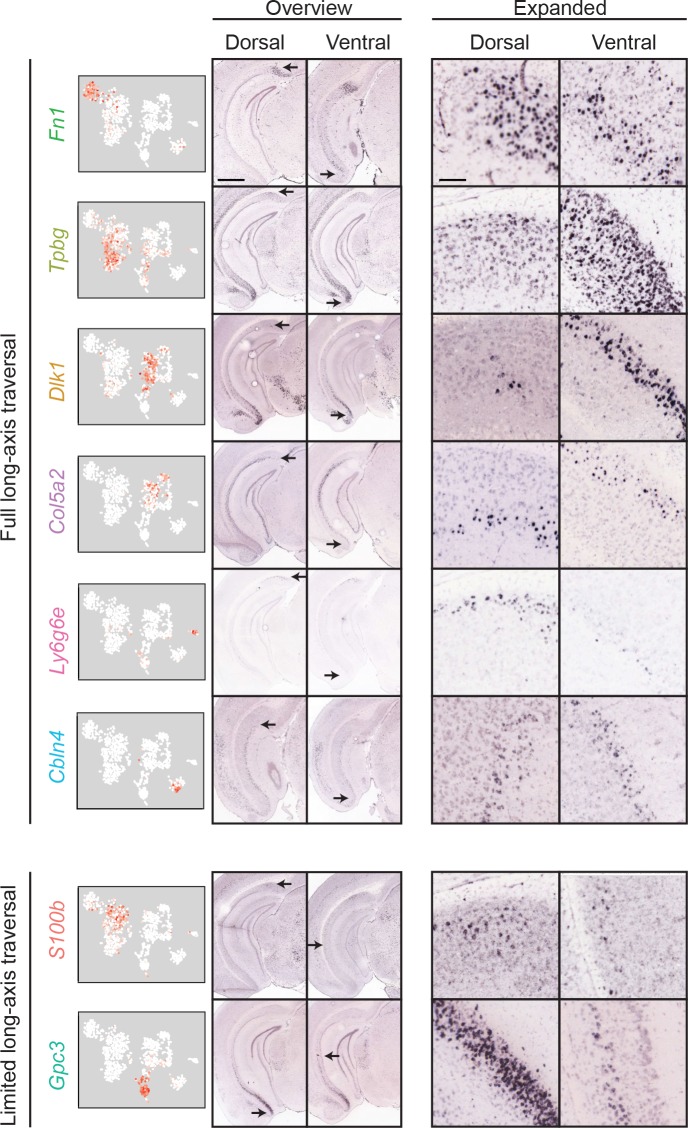
Figure 6. Most clusters span the full extent of the long axis.
First column: scRNA-seq clusters. Second and third columns: for each cluster, the dorsal (second column) and ventral (third column) extent of marker gene expression are indicated. Scale bar: 1 mm. Fourth and fifth columns: expanded illustration of the areas denoted by arrows. Scale bar: 100 μm.

