
Figure 9. Subiculum transcriptomes based upon downstream projections.
(A) Cells corresponding to three downstream projections (prefrontal cortex, ‘PFC’; nucleus accumbens, ‘NA’; amygdala) are highlighted (red). (B) t-SNE plot of single-cell transcriptomes, illustrating cluster identity (as in Figure 2A). (C) Relative occupancy for each of the transcriptomic clusters, defined as the number of cluster-specific cells divided by the total number of projection cells, is shown for each projection class.

Figure 9—figure supplement 1. Projection-specific transcriptomes associated with replicate dataset.

(A) In the replicate dataset, cells corresponding to three downstream projections (prefrontal cortex, ‘PFC’; nucleus accumbens, ‘NA’; amygdala) are highlighted (red). (B) t-SNE plot of single-cell transcriptomes, illustrating cluster identity (as in Figure 2A). (C) Relative occupancy for each of the transcriptomic clusters, as in Figure 9C. (D,E) As in (B,C), but with coloring changed to match conventions of original dataset (as in Figure 2—figure supplement 3).
Figure 9—figure supplement 2. NA-projecting cells are associated with a different lamina than Tpbg-expressing cells.

Left: NA-projecting cells, labeled by AAV-SL1-CAG-tdT (rAAV2-retro: Tervo et al., 2016) following injection into the NA. Middle: expression of Tpbg. Right: overlay. Note that NA-projecting cells largely emerge from more superficial laminae than Tpbg-expressing cells. Overall, 97% of labeled cells were mutually exclusive for Tpbg expression and PFC projections (n = 275 total cells from n = 2 animals). Scale bar: 100 μm.
Figure 9—figure supplement 3. Spatial representation of projection classes.
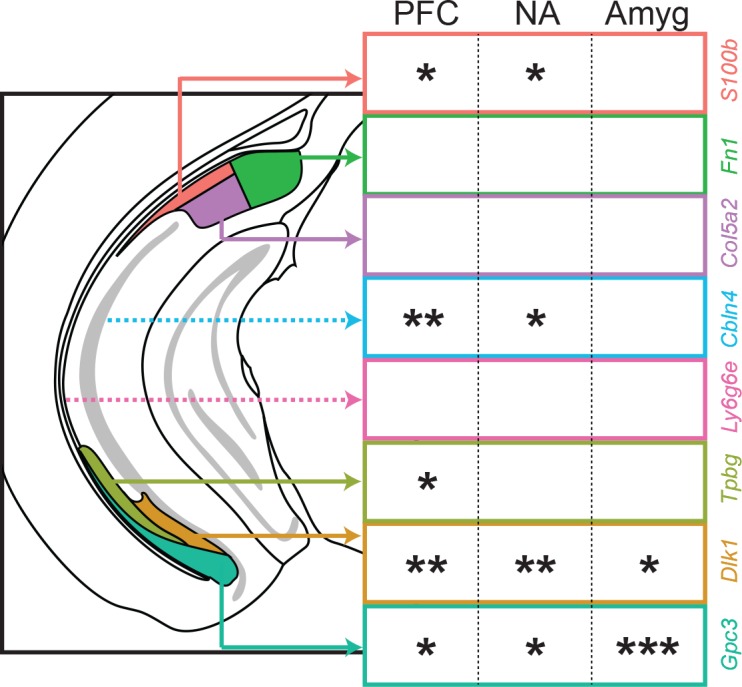
For the three projection classes examined in this study (PFC, NA, amygdala), projection class strength is shown on a per-subclass basis. Single, double, and triple asterisks denote at least 5%, 20%, and 50% of subiculum projections associated with the corresponding subclass. Dashed lines indicate subclasses with spatial locations at different anterior or posterior sections than that represented in the schematic.