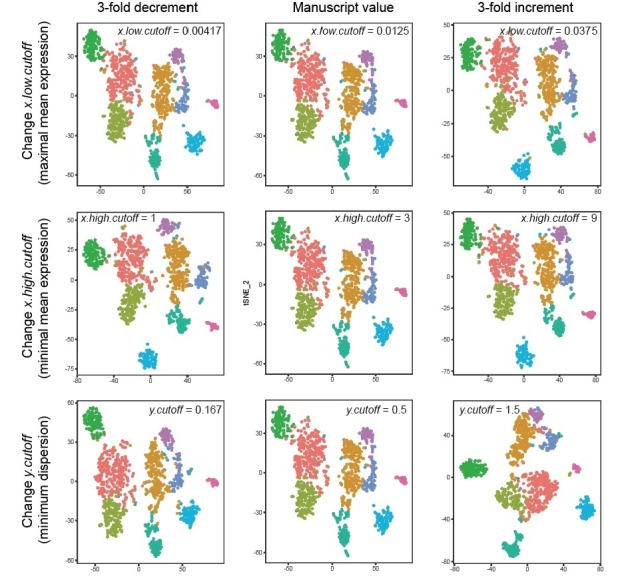
Author response image 3. Robustness of clusters across threshold values.

Each row corresponds to changing the value of a given parameter inherent to the FindVariableGenes call; specifically, x.low.cutoff (top row), x.high.cutoff (middle row), and y.cutoff (bottom row). Values explored are 3-fold decrements (left column) and 3-fold increments (right column) relative to manuscript value (middle column). Left to right, this constitutes nearly an order of magnitude difference in the parameter value. T-SNE visualizations and clustering results are shown for each parameter regime. Colours denote clusters obtained by graph-based approach used in main manuscript, with colouring associated with marker genes in main manuscript. Note, although in principal such lusters may be strongly affected by changes in these cutoff values, in practice they are not: marked stability is present in the number of clusters, the number of cells per cluster, and the marker genes associated with each cluster.
