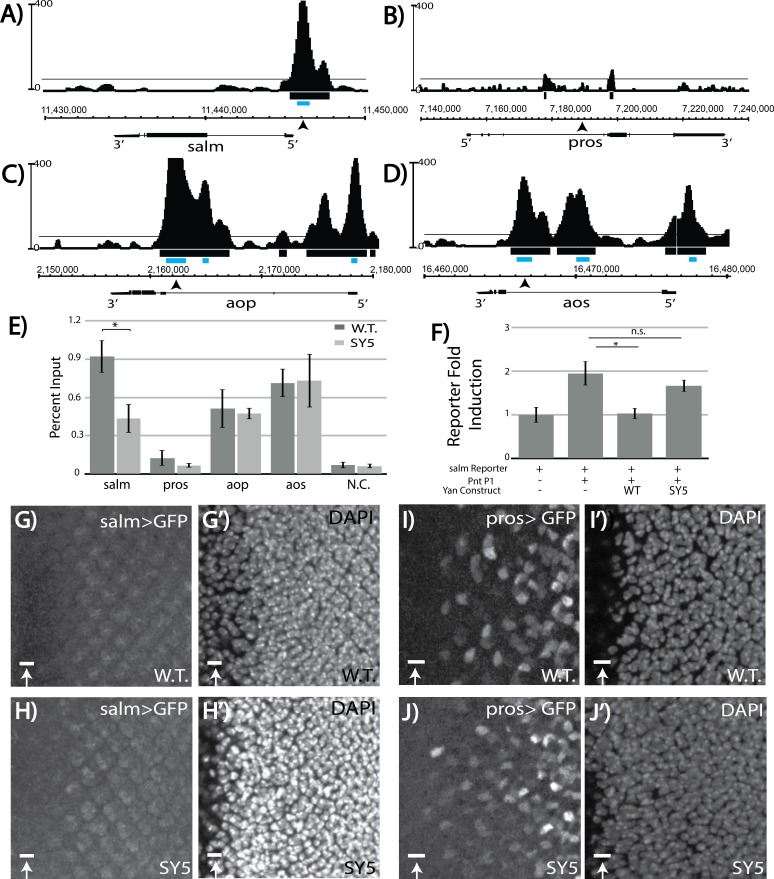
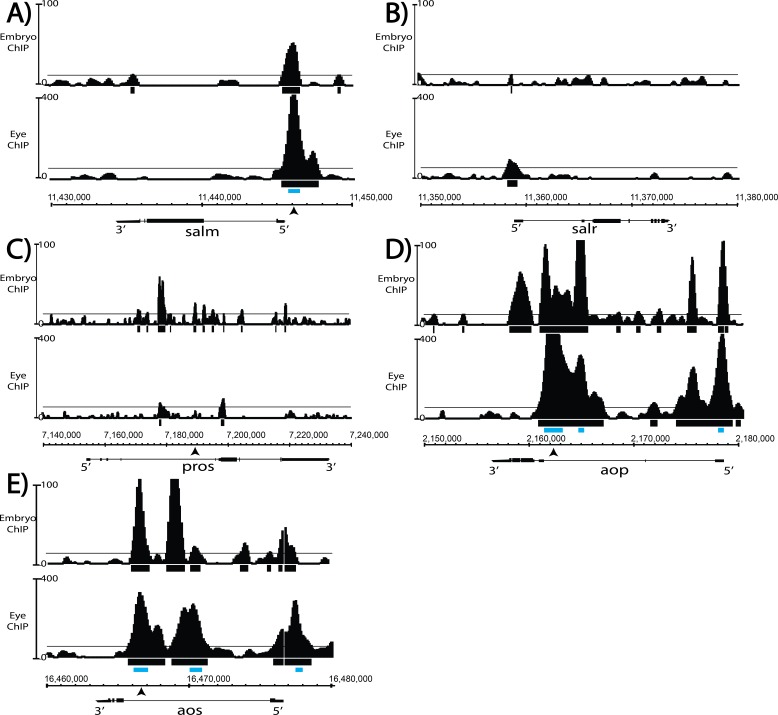
Figure 7. Salm is a direct Yan target and is specifically derepressed in yanSY5 mutants.
(A–D) ChIP-seq tracks of Yan binding in third instar larval eye discs, represented as smoothed tag density with a scale of number of reads per million; alignment was performed to Drosophila genome assembly Dm3. For clarity, the longest isoform of each gene is depicted, with 5’ and 3’ ends noted. Arrows mark the location of the primers used for ChIP-qPCR; gray boxes mark the location of peaks called by MACS (see Figure 7—source data 1). (A) spalt major locus (salm). (B) prospero locus (pros). (C) yan locus (aop). (D) argos locus (aos). (E) ChIP-qPCR of wildtype and yanSY5 eye discs. Error bars represent SEM of n = 3 biological replicates. Significance was calculated by Student’s T-test *, p<0.05. (F) Transcription assays with the spalt reporter. Error bars represent SEM of n = 4 biological replicates. Significance was calculated by Student’s T-test *, p<0.05; n.s., not significant. (G–H) spalt reporter-driven GFP expression, in a wildtype (G) and SY5 background (H). (I–J) pros reporter-driven GFP expression, in a wildtype (I) and SY5 background (J). Scale bars represent five microns.


