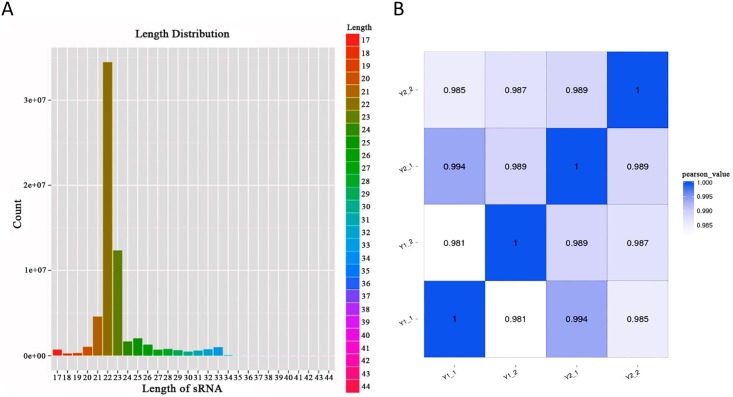
Fig 2. Length distribution of sRNAs and correlations between the samples.
A: The x-axis represents the length of the sRNA, and the y-axis represents the proportion of sRNAs with different lengths. The sequence length distribution reflects the types of sRNAs. B: Smaller correlations are closer to white; while larger correlations (closer to 1) are closer to blue.

