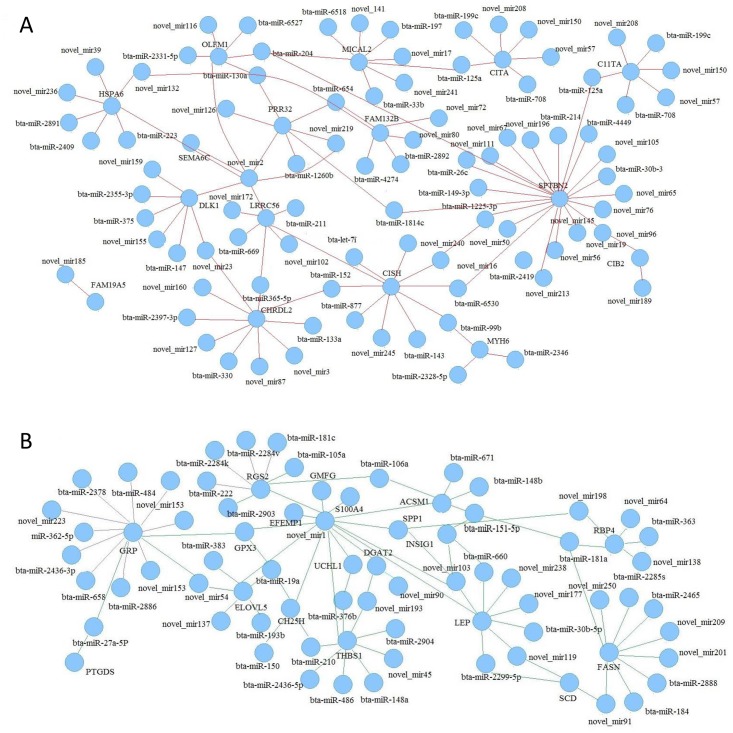
Fig 4. miRNA-target interaction network.
A: Upregulated miRNAs and their downregulated target genes. B: Downregulated miRNAs and their upregulated target genes. Red lines represent the intensity of the interaction between the upregulated miRNAs and their downregulated target genes; green lines represent the intensity of the interaction between the downregulated miRNAs and their upregulated target genes.

