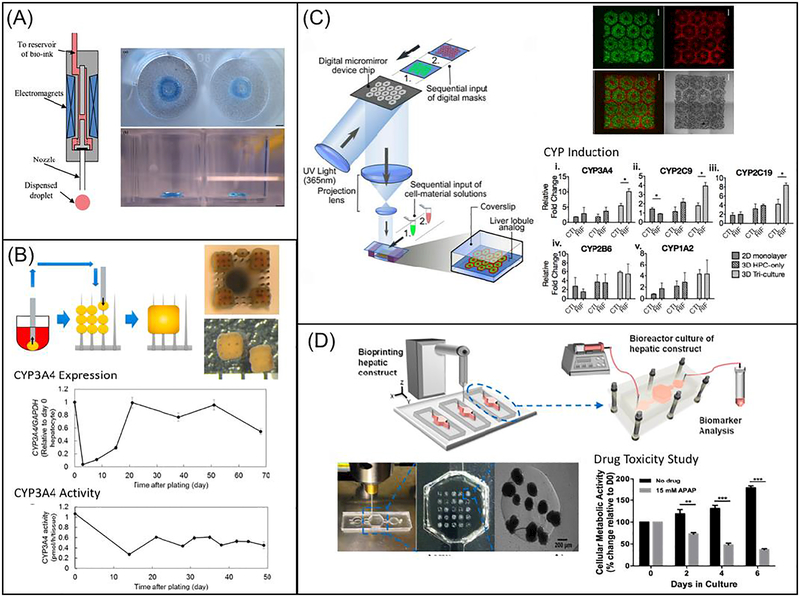
Fig. 2.
3D bioprinting of liver tissue models: (A) Schematic diagram showing the inkjet-based printing setup (left) and bright field image showing the printed construct stained in blue (right). (Reprinted from: [196]) (B) Schematic diagram showing the process of building the construct from spheroids, with the top and side views of the construct on the top right. Plots showing expression (middle) and activity (bottom) of CYP3A4 over time (Reprinted from: [198]) (C) Schematic diagram showing the DLP-based bioprinting system, with the fluorescence and bright field images of 3D printed liver construct on the top right. Bar charts showing CYP enzyme induction on lower right. Scale bars are 500 μm. (Reprinted from:[126]) (D) Schematic diagram showing the direct 3D printing within microfluidic chip, with images showing the microfluidic setup and printed structure on lower left. Bar chart showing drug toxicity study on bottom right (Reprinted from:[199])

