Figure 3.
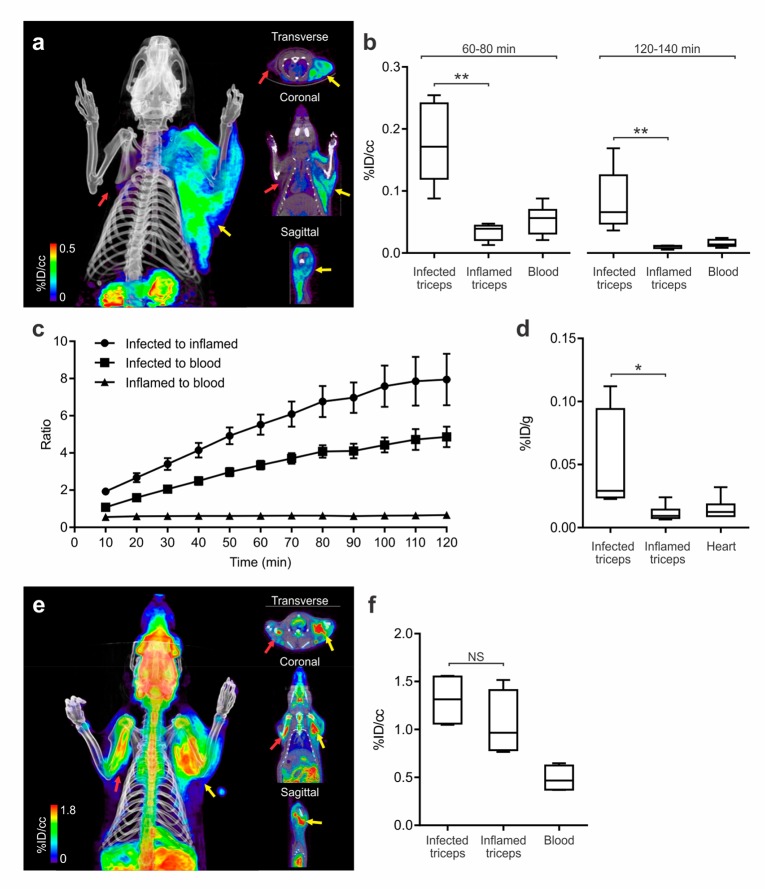
2-[18F]F-PABA accumulation in infection compared to sterile inflammation. (a) 2-[18F]F-PABA PET/CT images of rats with S. aureus infection in the right triceps (yellow arrow) and sterile inflammation in the left triceps (red arrow). The images are a three-dimensional projection, transverse, coronal, and sagittal views 60–80 min post-tracer injection. (b) Comparison of 2-[18F]F-PABA accumulation represented as % injected dose per cc (%ID/cc) in infected triceps, inflamed triceps, and blood 60–80 and 120–140 min after tracer injection. **P < 0.001 from a two-tailed Mann–Whitney U Test (n = 7). (c) Time-dependent accumulation of 2-[18F]F-PABA in infected and uninfected triceps compared to the blood (left heart ventricle). Data represented as mean and standard error of the mean (n = 7). (d) Post-mortem ex vivo analysis of 2-[18F]F-PABA biodistribution in infected and uninfected triceps and heart represented as % injected dose per gram of tissue (%ID/g). The signal in infected triceps was 4.30 ± 0.82 higher compared to inflamed muscle. *P = 0.0043 from a two-tailed Mann–Whitney U Test (n = 6). (e) Three-dimensional reconstruction, transverse, coronal, and sagittal views of the [18F]FDG PET/CT of a rat infected with S. aureus in the right triceps (yellow arrow) and sterile inflammation in the left triceps (red arrow), 60–80 min after injection of the tracer. (f) Comparison of [18F]F-FDG accumulation 60–80 min postinjection in rats infected with S. aureus and sterile inflammation, represented as %ID/cc. There was no difference between the signal of infected versus inflamed triceps (P = 0.2, from a two-tailed Mann–Whitney U Test, n = 4). NS, not significant.

