
Figure 2.
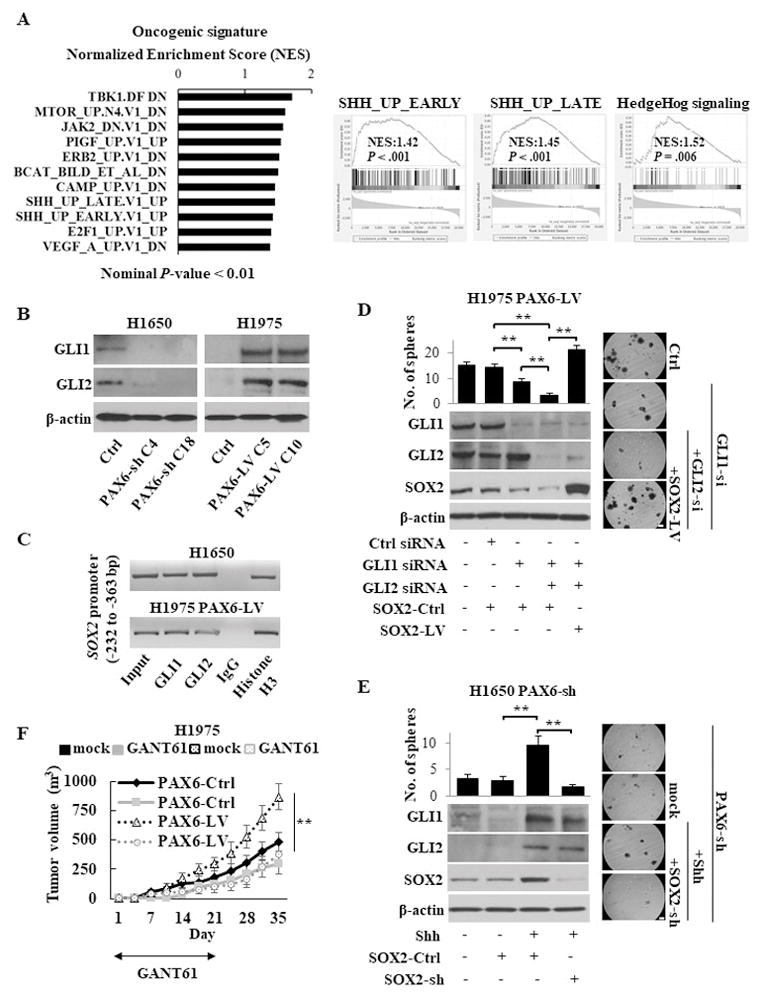
The PAX6-GLI-SOX2 signaling axis in LUAD CSCs. (A) Gene set enrichment analysis (GSEA) related to the oncogenic signatures and hallmarks in the groups with high and low expression of PAX6 in the TCGA LUAD cohort. Left, the enhanced oncogenic pathways in group with high PAX6 expression, as determined by a normalized enrichment score (NES); Right, the enrichment of Hedgehog pathway in group with high PAX6 expression. The GSEAs from both oncogenic signatures gene set (left and middle panels) and hallmarks gene set (right panel) showed the enriched Hedgehog pathway. SHH; Sonic hedgehog. (B) Western blotting analysis of GLI in stable PAX6-sh NCI-H1650 or PAX6-LV NCI-H1975 cells. (C) ChIP assays conducted on the proximal promoter region of the SOX2 gene using the indicated antibodies in NCI-H1650 or PAX6-LV NCI-H1975 cells. Histone H3 and normal IgG were used as the positive and negative control, respectively. (D) Sphere formation assay (upper left) and western blotting analysis of indicated molecules (lower left) of PAX6-LV NCI-H1975 cells transfected with GLI siRNA ± SOX2-LV. Right, representative images of sphere formation (scale bars, 200 μm). The spheres over 100 μm were counted. (E) Sphere formation assay (upper left) and western blotting analysis (lower left) of PAX6-sh NCI-H1650 cells stimulated with recombinant human Sonic Hedgehog ligand (Shh; 1μg /ml) after transfection with SOX2-sh or SOX2-Ctrl. Right, representative images of sphere formation (scale bars, 200 μm). (F) The in vivo tumorigenesis of stable PAX6-LV or PAX6-Ctrl NCI-H1975 cells in the presence or absence of the GLI antagonist GANT61 (50 mg/kg) treatment for 21 days (five mice per group).
Each error bar indicates mean ± SEM. **, P <0.01 (Kruskal–Wallis with post-hoc test [D, E, and F]). See also Fig. S4.