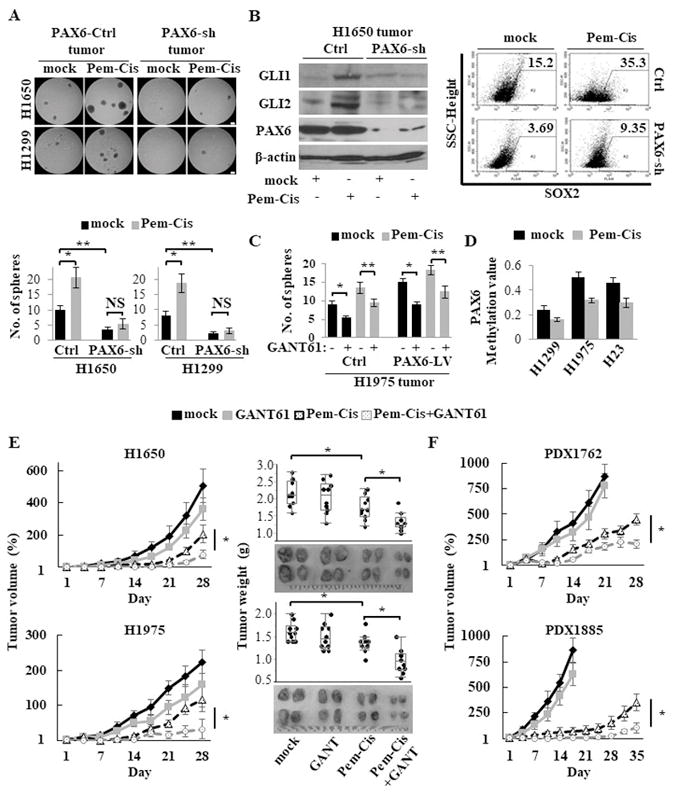
Figure 4.

CSC expansion following chemotherapy abrogated by targeting the PAX6-GLI-SOX2 axis in xenograft models. (A) Sphere formation assay of cancer cells isolated from xenografted tumor tissues after treatment with pemetrexed (75 mg/kg, once daily, 5 days on and 2 days off) plus cisplatin (4 mg/kg, once every 7 days; Pem-Cis) chemotherapy for 14 days in PAX6-sh or PAX6-Ctrl xenograft models (NCI-H1650 and NCI-H1299 cells). Upper, representative images of sphere formation (scale bars, 200 μm); Lower, number of spheres over 100 μm. (B) The expression levels of GLI, PAX6, and SOX2 of xenografted tumor tissues after treatment with Pem-Cis chemotherapy for 14 days in PAX6-sh or PAX6-Ctrl NCI-H1650 xenograft models, as measured by western blotting analysis for GLI and PAX6 (left) and flow cytometry for SOX2 (right). (C) Sphere formation assay of cancer cells isolated from xenografted tumor tissues after treatment with Pem-Cis chemotherapy in the presence or absence of the GLI antagonist GANT61 (50 mg/kg) treatment for 14 days in PAX6-LV or PAX6-Ctrl NCI-H1975 xenograft models. (D) The promoter methylation levels of the PAX6 gene of xenografted tumor tissues after treatment with Pem-Cis chemotherapy for 14 days in xenograft models, as measured by Q-MSP. (E) The in vivo therapeutic efficacy of the combination of Pem-Cis chemotherapy for 14 days with GANT61 (50 mg/kg) for 21 days in NCI-H1650 and NCI-H1975 xenograft models (five mice per group). Left, tumor growth curve; Right, tumor weight from both flanks of five mice per group. Growth curves were calculated by comparing the tumor size before any treatment with the size at different time points of therapy. (F) The in vivo therapeutic efficacy of the combination of Pem-Cis chemotherapy with GANT61 (50 mg/kg) in patient derived xenograft (PDX) models (five mice per group).
Each error bar indicates mean ± SEM. *, P <0.05; **, P <0.01 (Wilcoxon–Mann–Whitney test [A and C] and Kruskal–Wallis with post-hoc test [E and F]). See also Fig. S7.
