
Figure 1 |.
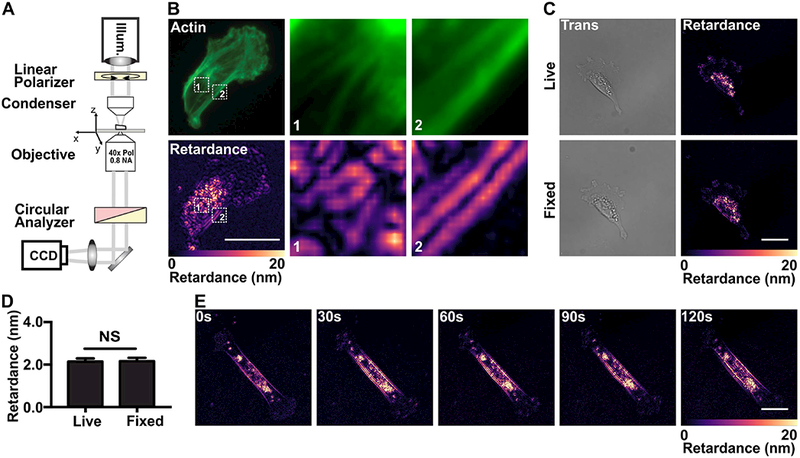
Setup of the QPOL system and effects of fixation on cellular retardance.
(A) Optical diagram of QPOL showing the position of optical component including the illumination (Illum.) and the acquisition camera (CCD). (B) Fluorescent image of a MDA-MB-231 cell showing fibrillar actin along with the corresponding retardance (Retardance) signal. Magnified views of regions 1 and 2 (numbered dashed boxes) from each image set are provided. (C) Images showing the comparison between the transmitted light (Trans) and retardance (right) immediately before (Live) and after fixation (Fixed) of a MDA-MD-231 cell seeded on collagen-coated glass slides. (D) Corresponding quantification of the average retardance of live (n=39) and fixed cells (n=39). (E) Image sequences showing the retardance of a live MDA-MB-231 cell over the course of 120s. (Data presented as mean ± SEM, Scale bar = 25 μm, NS indicates p>0.05).