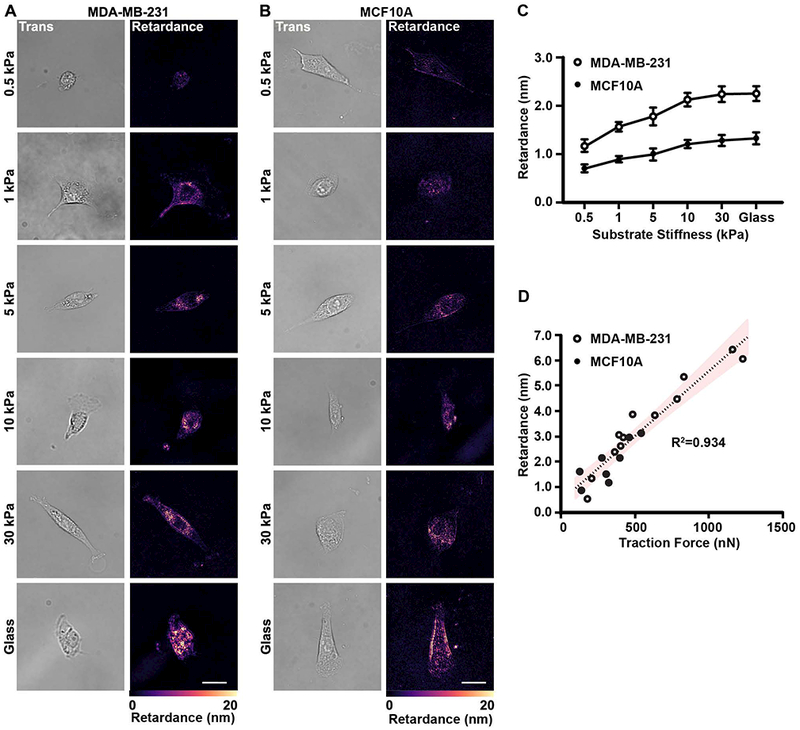
Figure 3 |.

Retardance correlates with substrate stiffness-mediated cell contractility.
(A) Transmitted light (Trans) and retardance (Retardance) images of MDA-MB-231 cells seeded on polyacrylamide substrates with a range of stiffness (0.5, 1, 5, 10 and 30 kPa) and on glass. (B) Transmitted light and retardance images of MCF10A cells seeded on polyacrylamide substrates with the same stiffness values as in (3a). (C) Corresponding quantification of the average retardance as a function of increasing stiffness for both MDA-MB-231 (0.5 kPa n=77, 1 kPa n=80, 5 kPa n=94, 10 kPa n=90, 30 kPa n=88, glass n=87) and MCF10A (0.5 kPa n=77, 1 kPa n=90, 5 kPa n=110, 10 kPa n=96, 30 kPa n=105, glass n=93). Data presented as mean ± SEM. (D) Scatter plot of the retardance of single cells as a function of the total traction forces for MDA-MB-231 (n=12) and MCF10A (n=7) cells. The resulting data was fit with the linear regression (dashed line) and confidence interval (95%). The R2 value is also provided. (Scale bar = 25 μm)
