
Figure 5 |.
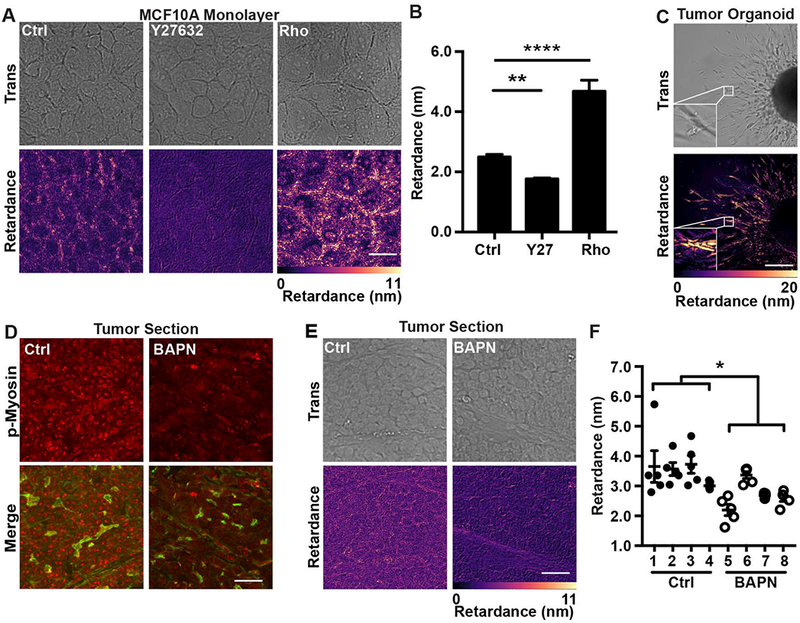
Cell contractility influences the retardance of complex biological samples in vitro, ex vivo and in vivo.
(A) Transmitted light (Trans) and retardance (Retardance) images of MCF10A cell monolayers treated with the vehicle (Ctrl), Y27632 or with the Rho activator II (Rho) along with (B) the corresponding average retardance (n=45). (C) Retardance of ex vivo tumor organoid isolated from a MMtV-PyMT mouse and embedded within a 3D collagen gel. The inset image shows the increased signal intensity in the invading cells. (D) Representative fluorescence images of tumor tissue sections from PyMT mice stained for p-MLC (p-Myosin; red) and actin (Merge; green) and treated with vehicle (Ctrl) or BAPN (BAPN). (E) Transmitted light and retardance images of mammary tumor sections with (BAPN) or without (Ctrl) BAPN treatment along with (F) the corresponding quantification of the retardance of Ctrl (n=4 mice) and BAPN (n=4 mice) treated tumor sections from individual MMTV-PyMT. Each tumor section was imaged in five different locations. (Data presented as mean ± SEM, Scale bar = 25 μm, * indicates P< 0.05, ** indicates P<0.0050, **** indicates P<0.0001 vs. Ctrl)