
Figure 1: Changes in astrocyte and fsPV MGPs are consistent across cortical datasets from six cohorts.
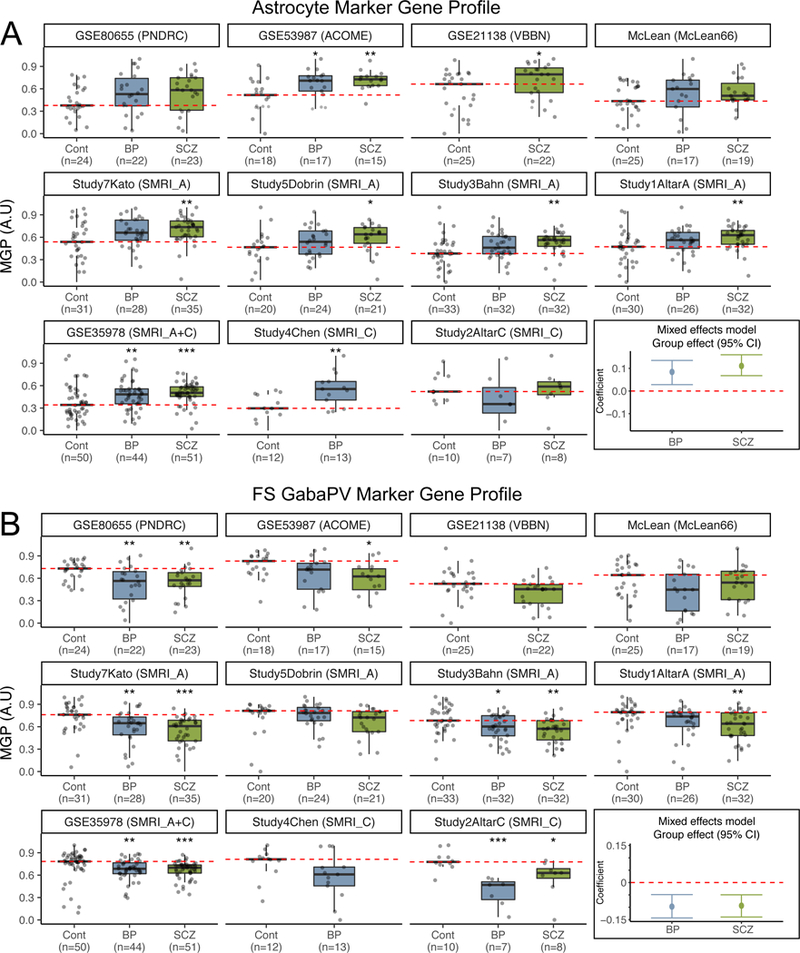
Astrocyte (A) and fsPV (B) MGPs organized by cohort, dataset and diagnostic group. Each point represents a single sample. Red dashed line indicates the median MGP in the control group. The last plot in each of A and B shows the 95% confidence intervals for the group effects based on linear mixed model analysis. * - Wilcoxon ranked sum p for comparison to controls < 0.05, ** - p < 0.01, *** - p < 0.001.