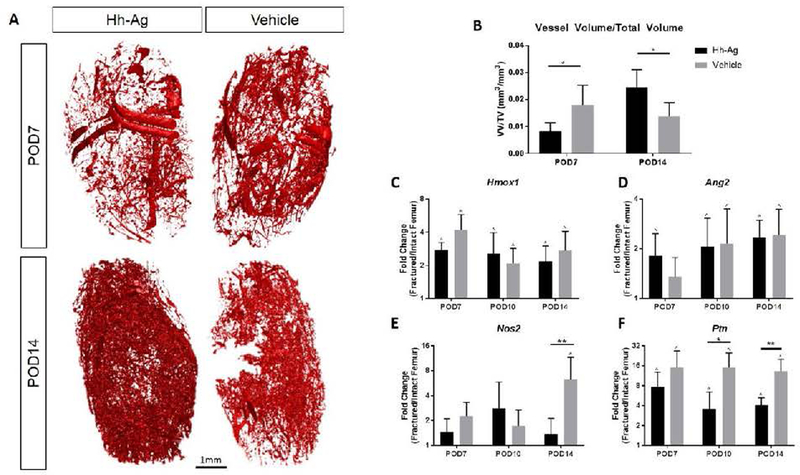
Figure 6.
(A) Representative reconstructions of vascular networks in and around the fracture callus. (B) At POD7 there was significantly less vasculature in Hh-Ag treated mice, but by POD14 there was significantly more vasculature (p<0.05). (C-F) Gene expression of angiogenic markers show no increase from the Hh-Ag treatment. (E) At POD14 Nos2 expression is higher for the vehicle treated specimen. (F) At POD10 Ptn expression is higher for the vehicle treated specimen. * treatment significant p<0.05, ** treatment significant p<0.01 (two-way ANOVA), ^ LF vs RF significant p<0.05 (t-test).

