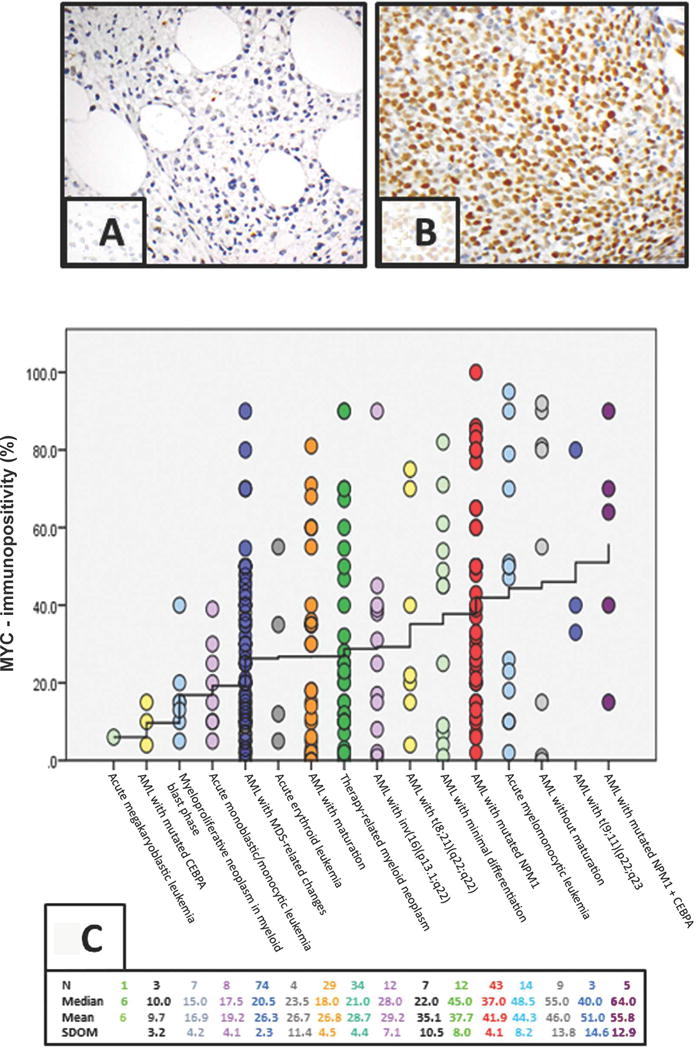
Figure 1.

A. Negative MYC-immunopositivity (≤3%) by immunohistochemistry (IHC) in AML patient.
B. Positive MYC-immunopositivity >90% of AML blasts by IHC.
C. MYC-immunopositivity by IHC by WHO categories: MYC values of 265 patients are plotted against WHO classification-categories. Each dot represents one patient. Position of each dot with respect to the X-axis identifies the WHO category to which the patient belongs, and its position with respect to the Y-axis gives the patient’s MYC expression. The WHO categories along the X-axis are arranged in an increasing order of their mean MYC-immunopositivity values. The “stair-step” interpolation line connects the mean MYC-immunopositivity values of WHO categories. The interpolation line is seen to rise from a MYC-immunopositivity value of 6% on the far left to a MYC value of 55.8% on the far right. Additional relevant statics are listed above the plot along four rows. The number of patients (N) in each WHO category is given along the first row. The median MYC-immunopositivity values of each category are listed along the second row. The third row contains the mean MYC-immunopositivity value of each WHO category; and the corresponding standard deviations of the means (SDOM) are listed along the fourth row.
