
Figure 2.
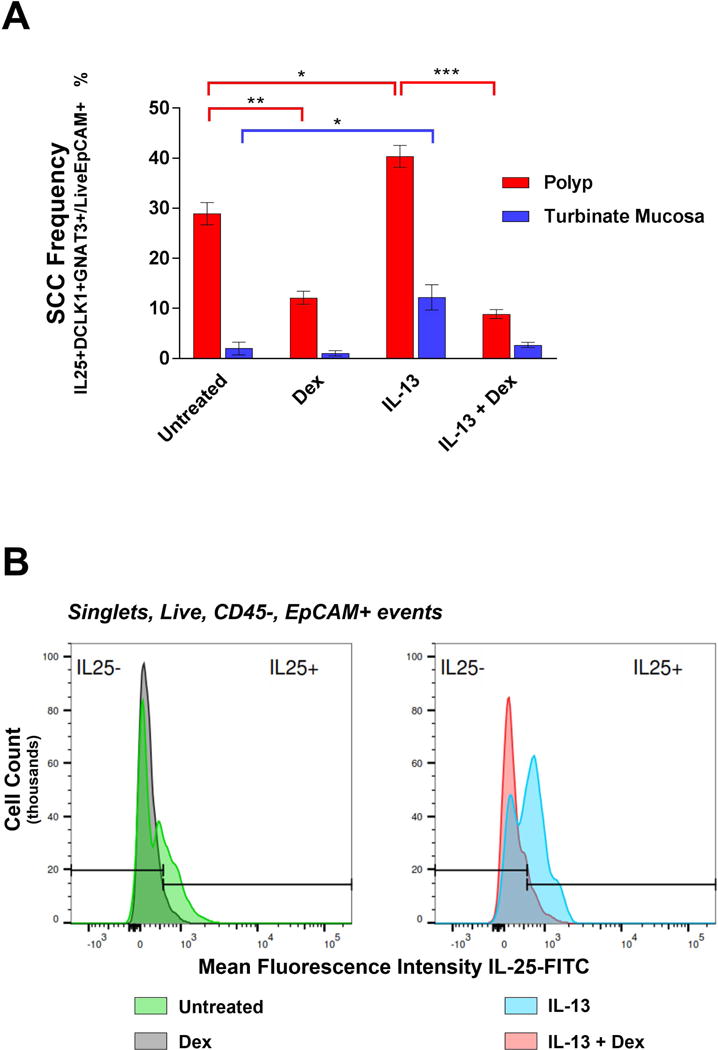
(A) Median and range of SCC population frequencies measured in tissue explants by flow cytometry (n=4 nasal polyps, n=3 turbinate mucosa in each of the 4 conditions, *p <0.05, **p <0.005, ***p <0.0005) (B) Mean fluorescence intensity of IL-25-FITC expression in respiratory epithelium (i.e., Live, CD45-, EpCAM+ subpopulation). Logarithmic histograms depict one representative explant under each of the four conditions.