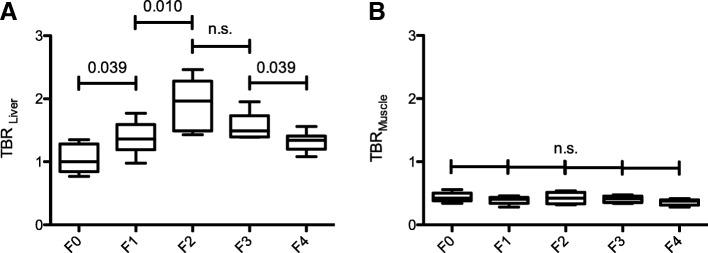
Fig. 2.
Shows the tissue-to-blood ratios (TBRLiver, (a); TBRMuscle, (b)) in patients with normal liver parenchyma and patients with liver fibrosis/cirrhosis. The Mann-Whitney U tests was used to compare the groups: no (F0), mild (F1), advanced (F2), severe liver fibrosis (F3), and liver cirrhosis (F4)

