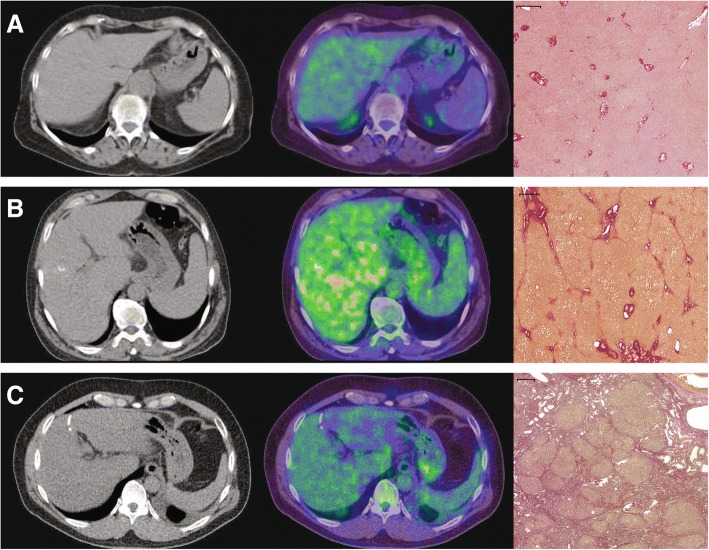
Fig. 4.
CT- (left column) and fused PET/CT-images (middle column) of patients with normal liver parenchyma (a), advanced liver fibrosis (b), and with liver cirrhosis (c) with the corresponding histopathology images demonstrating EVG staining (right column). CT images are displayed with the same window (400) and center (40) level. The fused PET/CT-images are shown with an upper SUV threshold of 7.0 using the spectrum color lookup table (SyngoVia) for PET. The scale on histological slices represents 500 μm

