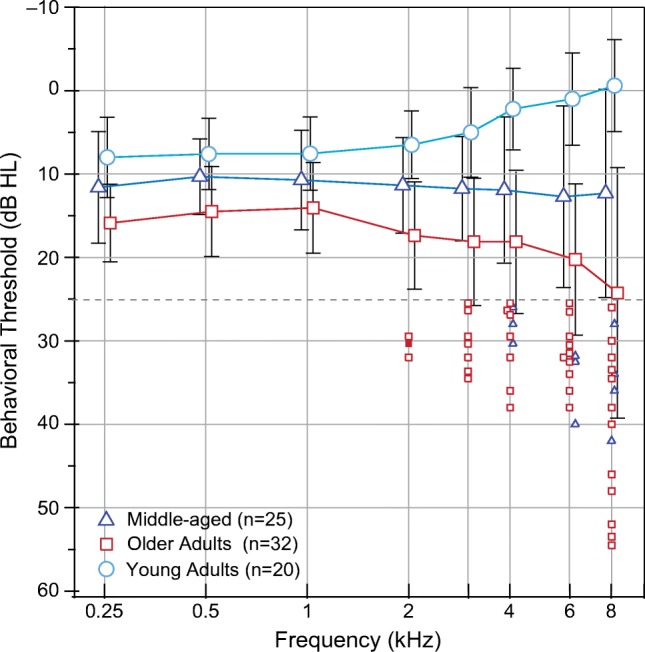
Fig. 1.

Mean audiogram (± 1 SD) for each of three age groups: young-adult, middle-aged adult, and older adult. The middle-aged and older-adult groups had some thresholds that fell outside of the range conventionally considered normal (i.e., 25 dB HL) although well within what is considered “normal” for their respective ages. The elevated thresholds are displayed as small individual symbols
