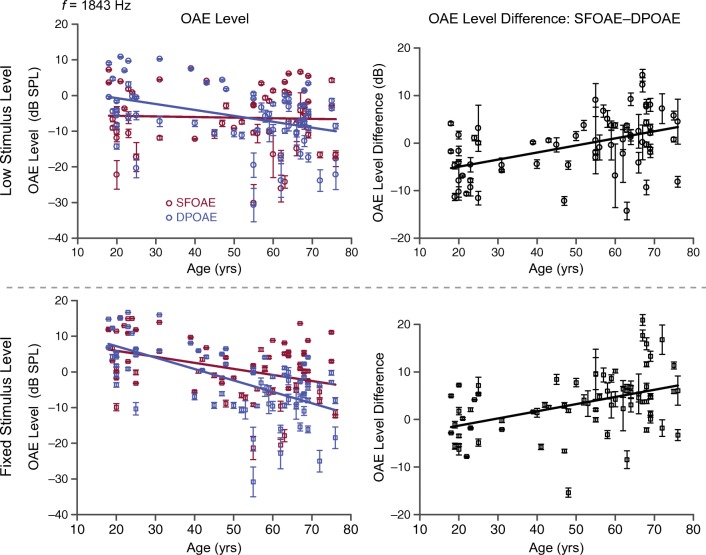
Fig. 6.
SFOAE (red) and DPOAE (blue) level values are plotted as a function of age. Here, the data are displayed for one center frequency, 1843 Hz, and two level conditions: low- and fixed-stimulus levels. Each data point includes error bars reflecting the uncertainty in the measurement of the estimate over the targeted half-octave band. A linear regression line fit separately to the SFOAE and DPOAE level data was always negative, indicating reductions in the level of both OAEs with age; however, the slope of DPOAE decline with age was steeper than that observed for SFOAE data. The panels in the right column show SFOAE–DPOAE level differences versus age and the linear regression lines fit to these difference scores. Data below 0 dB indicate the DPOAE is higher in level than SFOAE; points above 0 dB indicate that the SFOAE has become the relatively higher-level response with aging.

