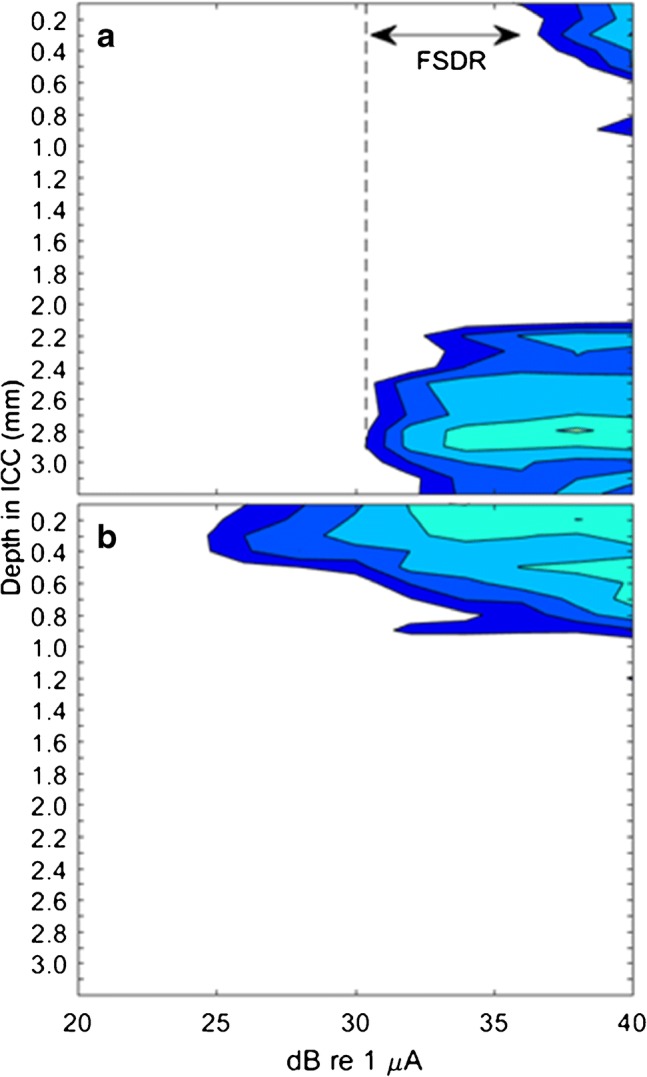
Fig. 1.

Spatial tuning curves (STCs) for two intraneural stimulation sites recorded in chronically deaf cat IN1204. Each of these sets of contours plots the sensitivity index, d’, in steps of 1 d’ unit. The vertical axis shows depth along the recording array in the central nucleus of the inferior colliculus (ICC), and the horizontal axis shows the stimulus current. Stimuli were single biphasic pulses, initially cathodic, 41 μs/phase. The stimulus site yielding the STC in a was relatively superficial in the nerve. The lowest stimulus levels excited only basal fibers (indicated by activity deep in the ICC). At higher levels, excitation spread to apical fibers. FSDR indicates the frequency-specific dynamic range, the range of currents over which activity was restricted to the lowest-threshold tonotopic region. The stimulus site in b was deeper in the nerve and activated only apical fibers over the range of currents that was tested
