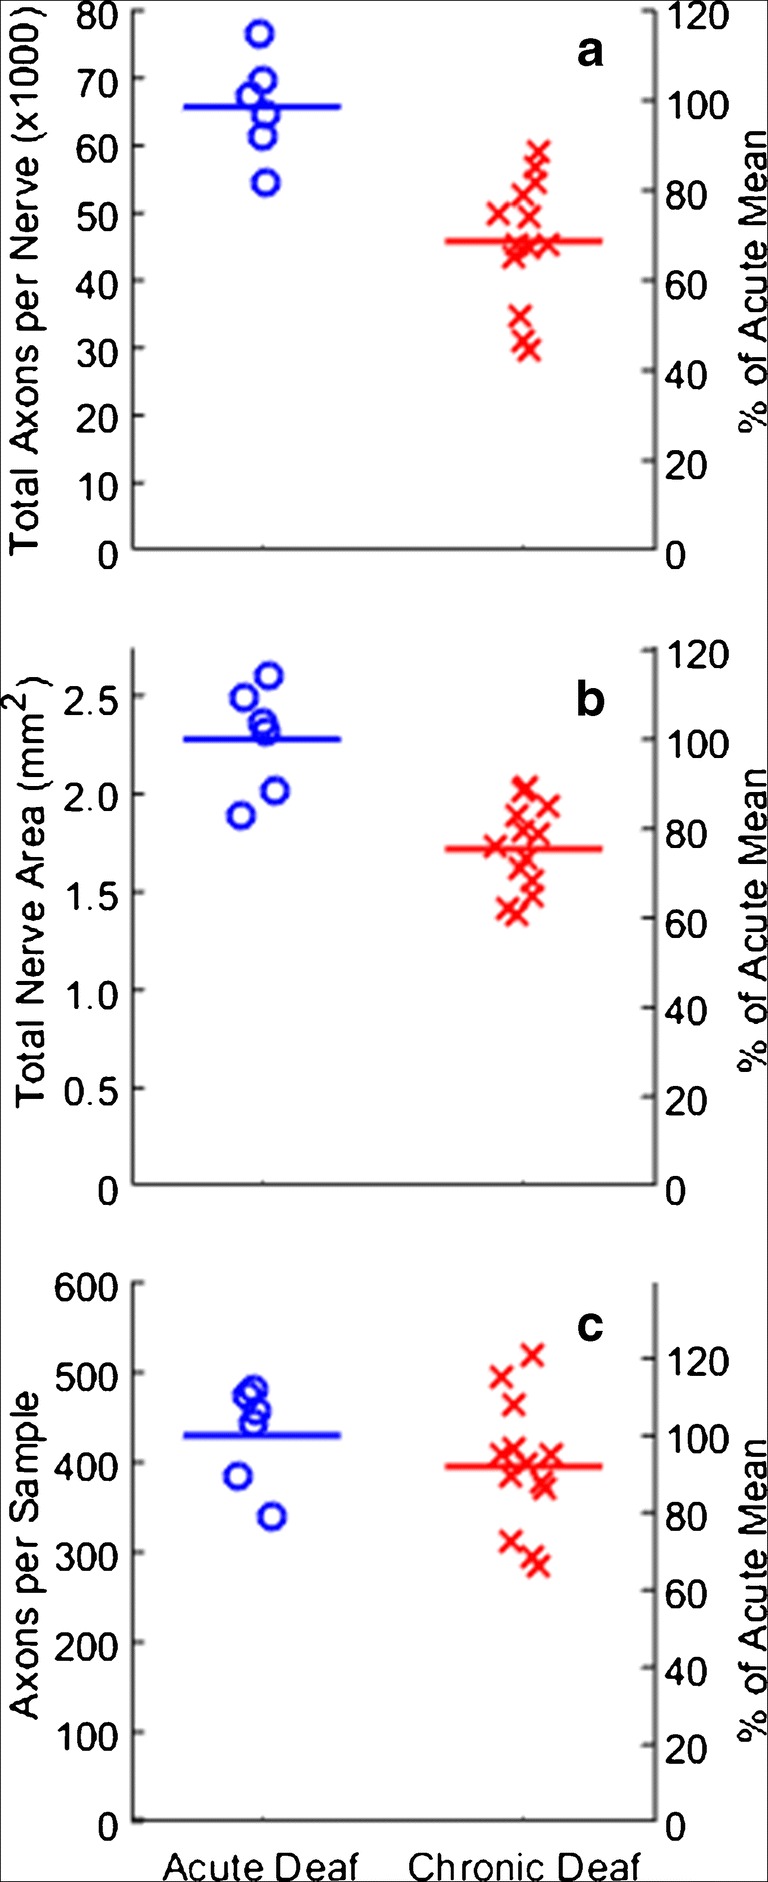
Fig. 4.

Nerve fiber populations in 6 auditory nerves taken from 3 normal-hearing, acutely deafened cats (blue o’s), and in 13 nerves taken from 8 chronically deaf cats (red x’s). a Total fiber count per nerve. The left axis gives raw fiber counts. b Total area of each nerve. c Mean number of fibers (averaged within each nerve) within each 0.0148-mm2 sample. In each panel, the right axis expresses values as percentages of the mean in the acute deaf condition
