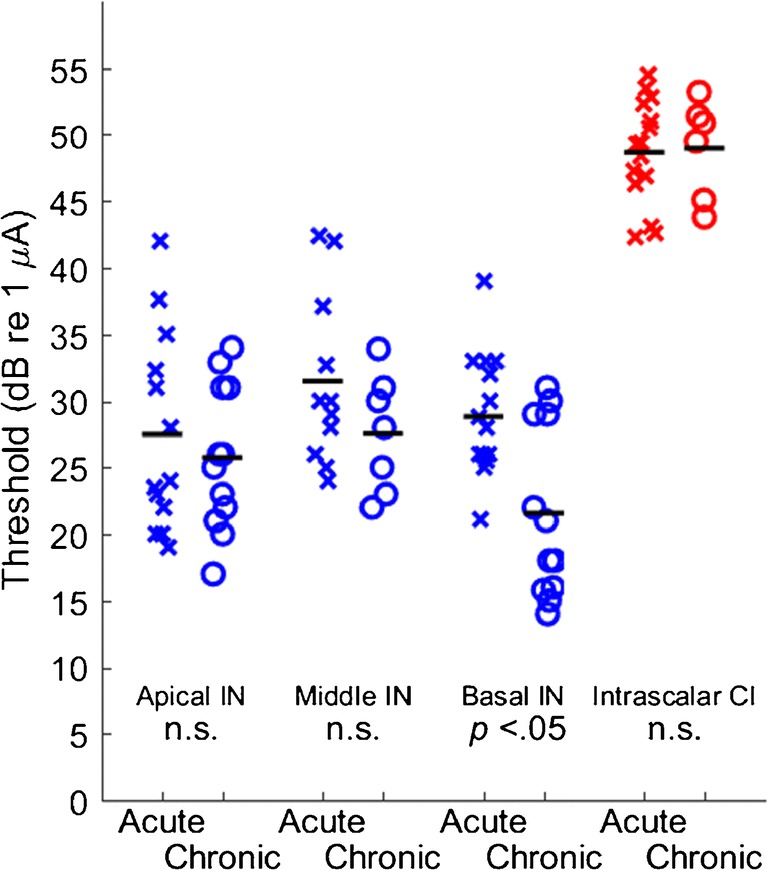
Fig. 5.

Thresholds for activation of ICC neurons by electrical cochlear stimulation. X’s and o’s indicate acute and chronic deafness conditions, respectively. Stimuli were single biphasic pulses, initially cathodic, 41 μs/phase, presented in a monopolar configuration. Data for intraneural (IN) stimulation, shown in blue, represent the lowest-threshold stimulus site in each animal eliciting apical-, basal-, or (when present) middle-turn patterns of activation. Data for intrascalar cochlear implant (CI) stimulation, shown in red, represent the lowest-threshold CI stimulus site in each animal, typically the most apical site. Symbols are jittered in the horizontal dimension to improve visibility. The horizontal lines indicate mean values for each condition. Only the basal IN thresholds were significantly different between acute and chronic deafness conditions
