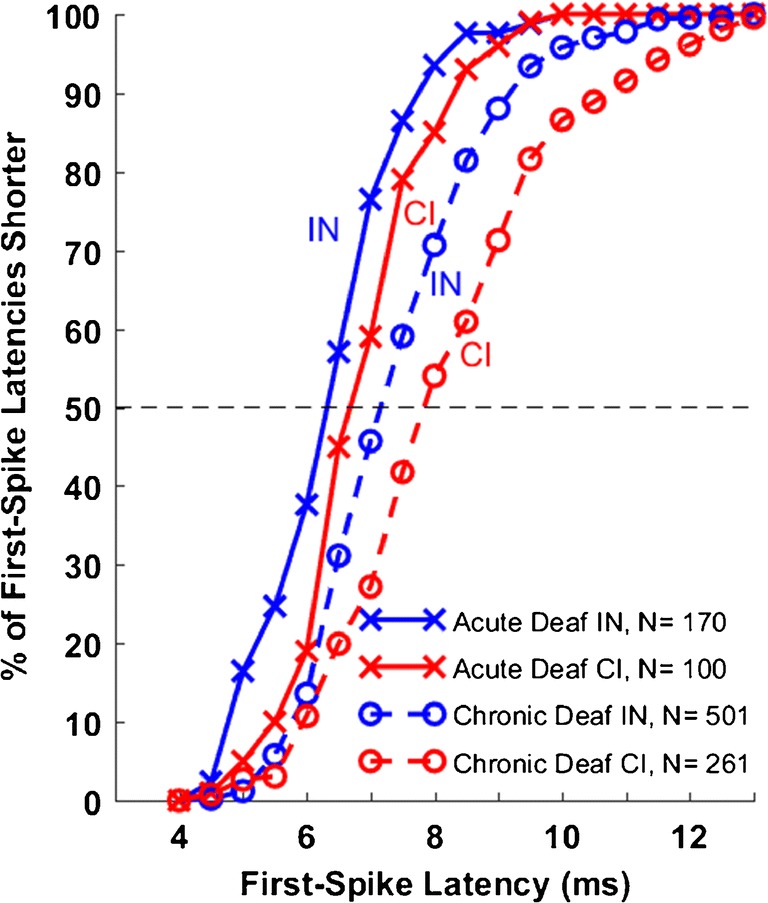
Fig. 9.

Distribution of first-spike latencies. The lines show, at each first-spike latency, the percentage of units having a latency equal to that value or shorter. Solid lines indicate data from the five acutely deaf cats, re-plotted from Middlebrooks and Snyder (2010). Other format details are as in Fig. 7
