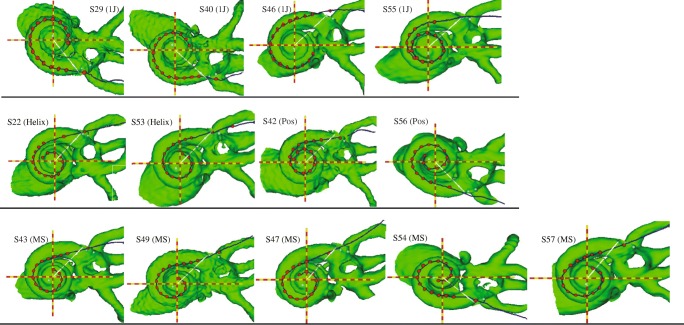
FIG. 2.
CT view of cochlea and electrode array along the midmodiolar axis (red and yellow dashed lines), for all subjects, organized by electrode array type. The evenly spaced red dots represent electrodes; the outermost dot represents the insertion depth marker. The white line represents the 0 ° reference point from which insertion depth is measured, extending from the midmodiolar axis. Row 1: 1 J; row 2: 1-J Helix and 1 J with positioner; row 2: Mid-Scala electrode array

