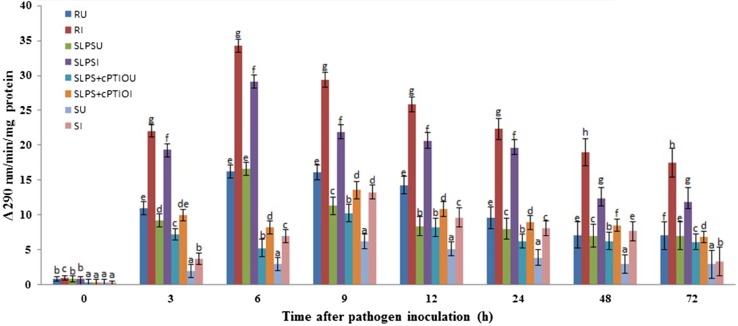
Fig. 4.
Time course analysis of PAL activity in resistant (R), LPS treated (SLPS), LPS treatment plus NO scavenger treatment (SLPS + cPTIO) and control/susceptible (S) pearl millet seedlings with (I) or without (U) S. graminicola Inoculation. PAL activity was determined as the amount of t-cinnamic acid formed from l-phenylalanine per mg of protein per min measured spectrophotometrically at a wavelength of 290 nm. Results are average of three independent experiments each carried out in four replicates. Vertical bars indicate standard error. Means designated with the same letter are not significantly different according to Tukey’s HSD at p ≤ 0.05

