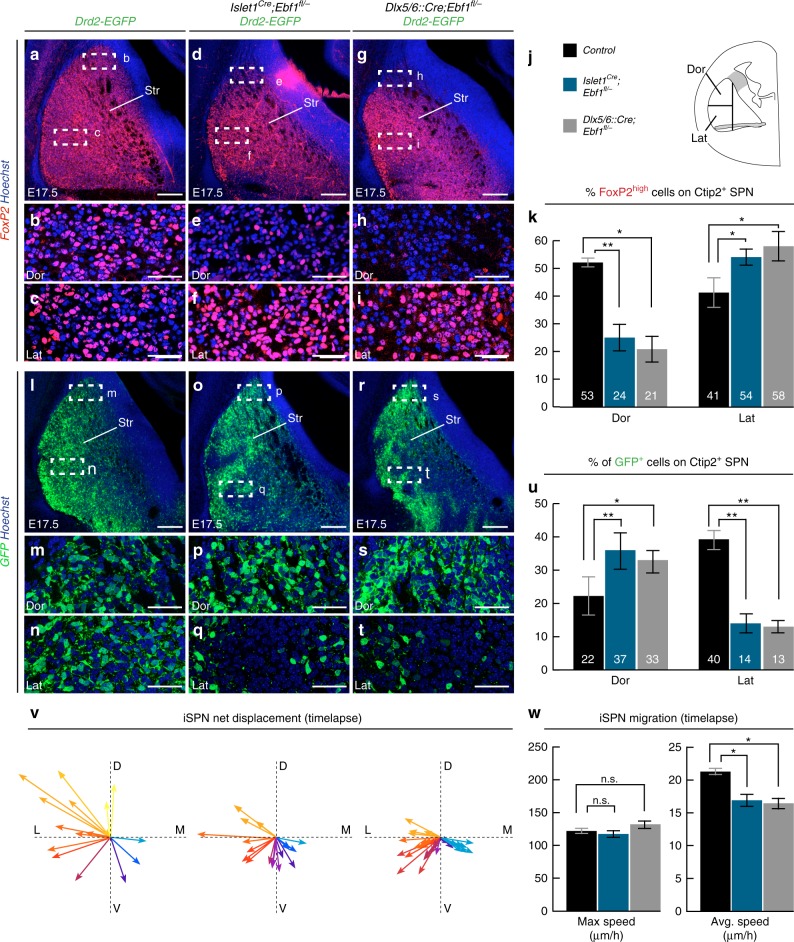
Fig. 7.
Ebf1 cKO affects iSPN migration and intermix with dSPN. a–j Distribution of FoxP2high; Ctip2 + dSPN is altered in Ebf1 cKOs at E17.5, with lower density in the dorsal (Dor) and higher in the lateral (Lat) part of the striatum (Str); the two regions are defined in (j) (n = 3 for each condition). k In control Dor Str, 53 ± 3.5% of all Ctip2+ SPN are Foxp2+, 24 ± 6% (p = 0.0079) in Islet1Cre;Ebf1fl/− and 21 ± 8%. (p = 0.03) in Dlx5/6::Cre;Ebf1fl/−. In control Lat Str, Foxp2 + cells form 41 ± 11% of Ctip2 + SPN, raising to 54 ± 3% in Islet1Cre;Ebf1fl/− (p = 0.01) and to 58 ± 11% in Dlx5/6::Cre;Ebf1fl/− (p = 0.03). l–t Distribution of Drd2-EGFP+;Ctip2+ iSPN is altered by Ebf1 cKO, with higher density in Dor Str and lower in Lat Str. u Quantification of iSPN distribution. In control Dor Str, 22 ± 12% of Ctip2+ SPN are GFP+. This percentage increases to 37 ± 11% in Islet1Cre;Ebf1fl/−;Drd2-EGFP (p = 0.007) and to 33 ± 7% in Dlx5/6::Cre;Ebf1fl/−;Drd2-EGFP (p = 0.03). Conversely, in the Lat Str, the percentage of of double-positive GFP+Ctip2+ iSPN equals 40 ± 6% in controls, 14 ± 6% in Islet1Cre;Ebf1fl/−;Drd2-EGFP (p = 0.008) and 13 ± 4% in Dlx5/6::Cre;Ebf1fl/−;Drd2-EGFP embryos (p = 0.008). v, w Analysis of iSPN migration at E15.5 in acute slices of Islet1Cre;Ebf1fl/−; Drd2-EGFP and Dlx5/6::Cre;Ebf1fl/−;Drd2-EGFP embryos. (v) Multidirectional displacement vectors from sample video tracking of control, Islet1Cre;Ebf1fl/−; Drd2-EGFP and Dlx5/6::Cre;Ebf1fl/−;Drd2-EGFP iSPN (colors illustrate directionality). w Trajectory analysis (Islet1Cre;Ebf1fl/−; Drd2-EGFP: 58 cells tracked, n = 3 independent experiments; Dlx5/6::Cre;Ebf1fl/−;Drd2-EGFP 29 cells tracked, n = 2 independent experiments) shows reduction of iSPN average speed after 180’ in Ebf1 cKOs (17,25 ± 1 μm/h for Islet1Cre;Ebf1fl/−; Drd2-EGFP, p = 0.02; 16,56 ± 1 μm/h for Dlx5/6::Cre;Ebf1fl/−;Drd2-EGFP p = 0.03) without significant alteration of maximum speed (117,8 ± 5 μm/h and 131 ± 6 μm/h, respectively; p = 0.47 for Islet1Cre;Ebf1fl/−; Drd2-EGFP and p = 0.55 for Dlx5/6::Cre;Ebf1fl/−;Drd2-EGFP when compared to control iSPN). Results are presented as mean ± standard deviation (k, u) or s.e.m (w). Two-tailed non-parametric Mann–Whitney U test was used for statistical comparison. * indicates p-value < 0.05, ** p-value < 0.01. Scale bars equal 200 μm (a,d,g,l,o,r), 50 μm (b,c,e,f,h,I,m,n,p,q,s,t). Dor, Dorsal; Lat, lateral; Str, striatum

