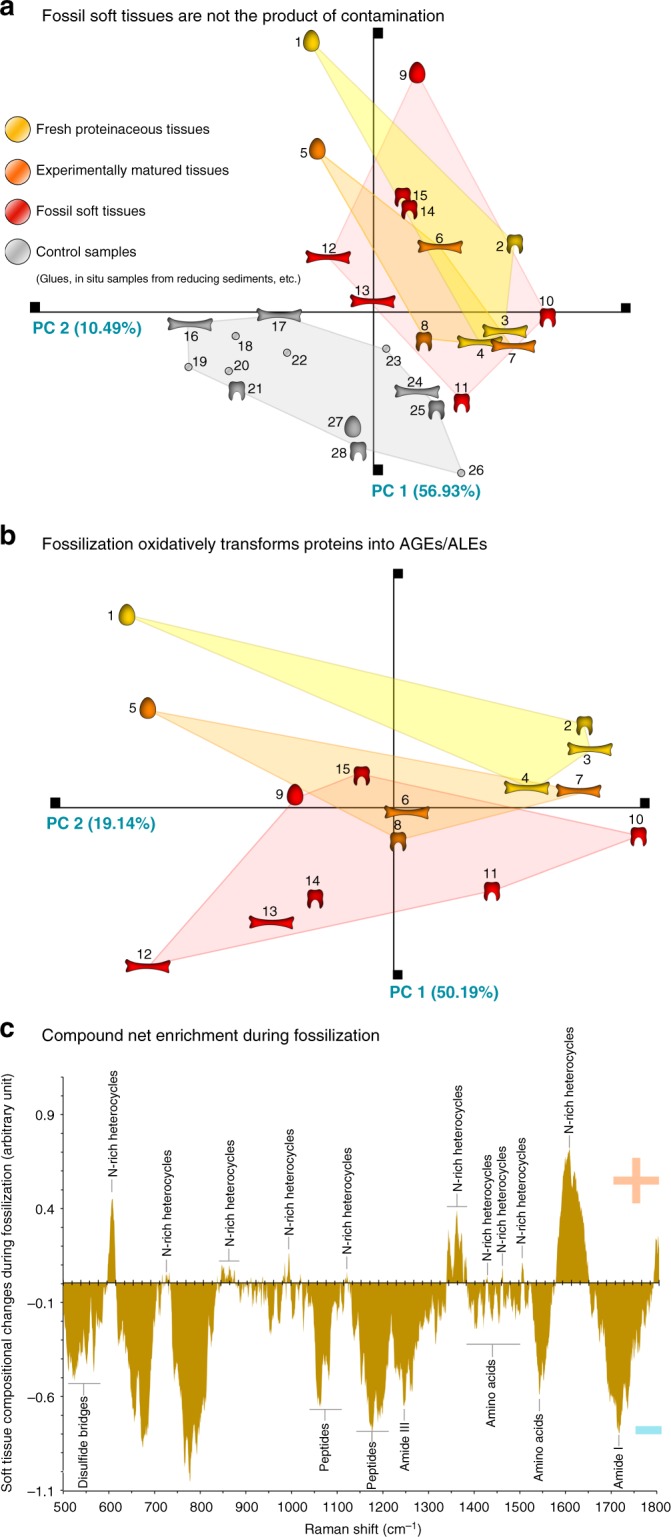
Fig. 4.

Chemospace and dissimilarity plot showing chemical similarity between modern, matured and fossil samples. a Chemospace including control samples (sediments, undecalcified samples from reducing settings, glues, epoxy resin; a total of 28 specimens). b Chemospace excluding control samples (a total of 15 specimens). Colored clusters represent the three main categories of samples analyzed in this study: control samples (gray), modern (yellow), experimentally matured (orange) and fossil hard tissues (red). 1 Rhea americana eggshell; 2 Lepisosteus osseus scale; 3 Gallus domesticus eggshell; 4 Alligator mississipiensis bone; 5 Rhea americana eggshell matured; 6 Gallus domesticus matured; 7 Alligator mississipiensis bone matured; 8 Lepisosteus osseus scale matured; 9 Heyuannia huangi eggshell; 10 Miohippus anceps tooth; 11 Allosaurus fragilis tooth; 12 Psammornis rothschildi eggshell; 13 Allosaurus fragilis bone; 14 paleonisciform scale; 15 paleonisciform scale; 16 crocodilian bone; 17 Iguanodon bernissartensis bone; 18 sediment surrounding Diplodocus bone; 19 epoxy resin; 20 sediment surrounding Maiasaura sp. remains; 21 Maiasaura sp. tooth; 22 sediment embedding Ichthyosaurus bone; 23 polyacrylamide glue; 24 Ichthyosaurus sp. bone; 25 Maiasaura sp. eggshell; 26 polyacrylamide glue on fossil bone; 27 Saltasaurus sp. eggshell; 28 Nothosaurus sp. tooth. c Dissimilarity plot illustrating soft tissue compositional changes through fossilization. An average Raman spectrum based on all fresh soft tissues (a total of 4 specimens acquired with 4 accumulations) was subtracted from that based on all fossil soft tissues analyzed (a total of 7 specimens acquired with 4 accumulations). The spectral bands indicating the net enrichment of proteinaceous soft tissues during fossilization correspond to pentosidine (depicted), a classic AGE/ALE marker
