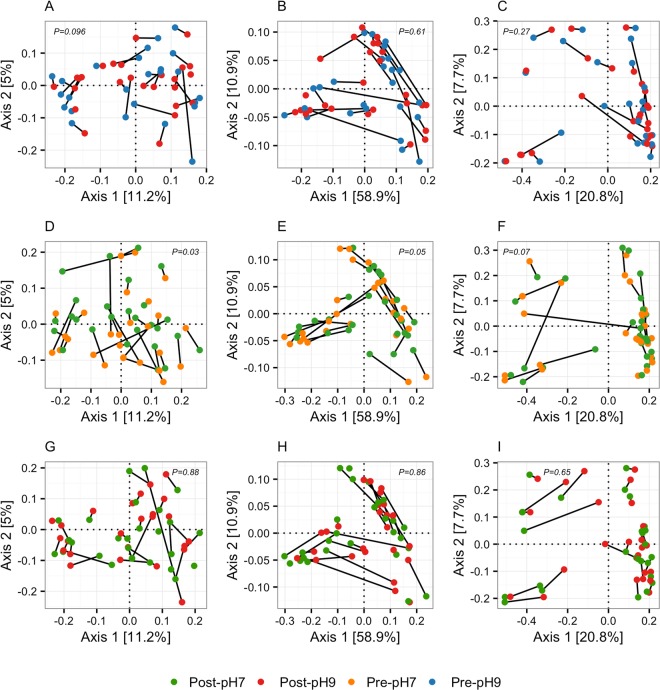
Figure 2.
Principal coordinate plots of faecal microbiota community structure. Principal coordinate plots (axes 1 and 2) of treatment effect on community structure based on unweighted UniFrac (A,D,G), weighted UniFrac (B,E,H), and Bray-Curtis distances (C,F,I). Samples from the alkaline (A–C) and neutral water intervention (D–F), as well as post-intervention samples from both periods (G–I) are depicted separately. Samples from the same participant are connected by solid lines. P-values are from permutational multivariate analysis of variance.

