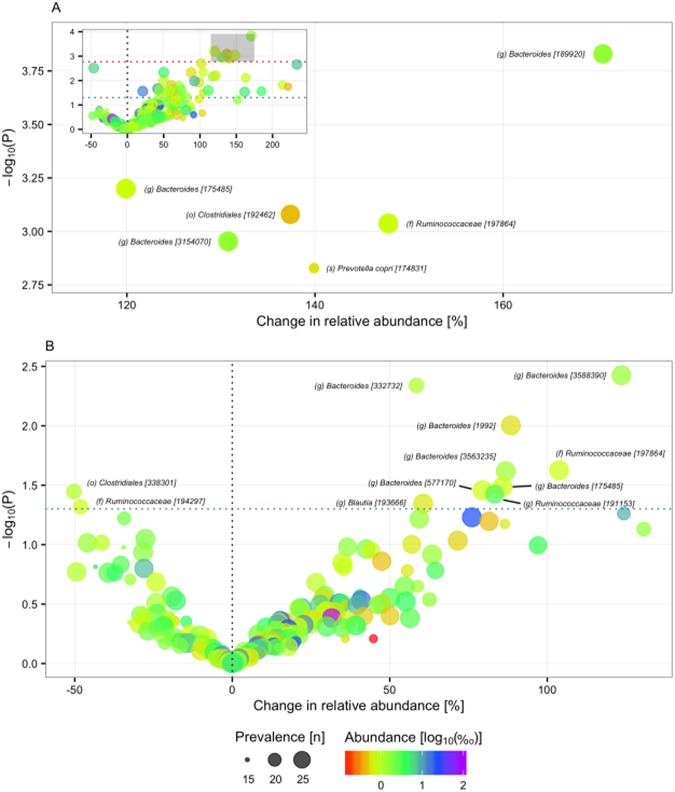
Figure 4.
Intervention effect on OTU composition. Change in relative abundance (% increase/decrease in geometric mean) of core OTUs during the neutral water (A) and alkaline (B) water interventions. Red dotted line indicates the cut-off corresponding to a Q-value of 0.05, and the blue dotted line indicates a P-values of 0.05. Prevalence indicates number of participants in which a given OTU is present in at least one sample. Abundance indicates mean relative abundance (‰) of a given OTU in baseline samples. Taxonomy of OTUs [Greengenes ID] is given at the lowest classified rank. o, order. f, family. g, genus.

