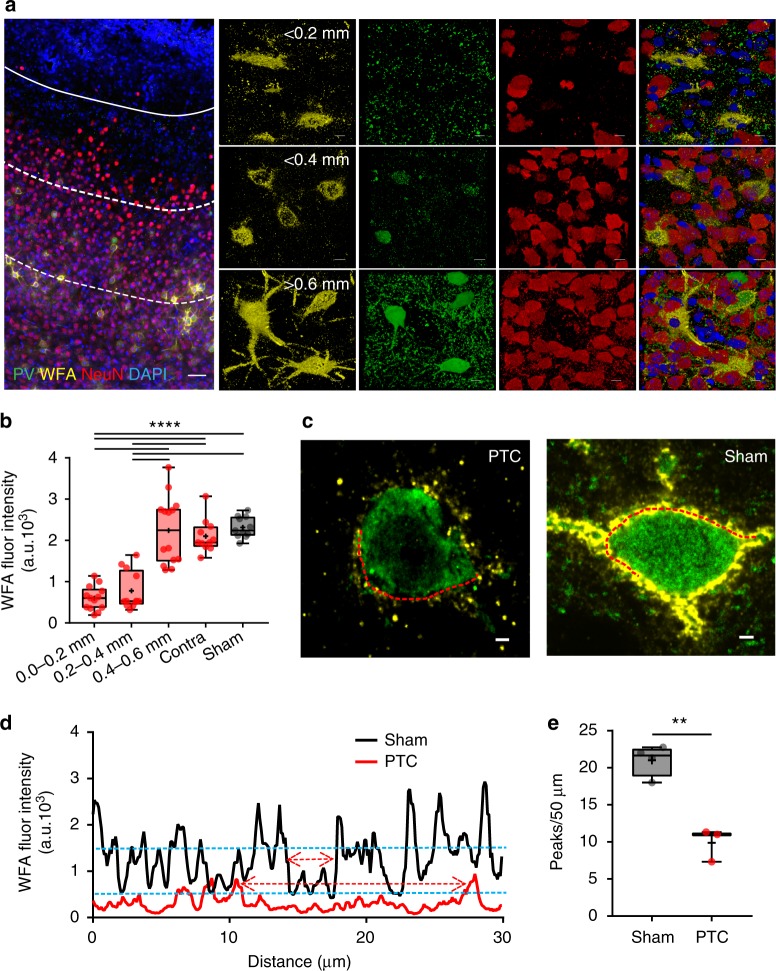
Fig. 2.
Disintegration of PNNs in the peritumoral cortex. a Confocal images of GBM22 PTC labeled with DAPI (blue), WFA (yellow), PV (green), and NeuN (red) showing spatial gradient of alterations. The distance between tumor border (white solid line) and each of the dotted lines is ~0.2 mm. Top panel images from <0.2 mm PTC show disintegrated PNNs (yellow) mostly lacking PV and NeuN and reduced neuronal cell numbers in close proximity of tumor. Middle panel images, in the 0.2–0.4 mm PTC, show a much higher number of NeuN+ neurons but few that contain PV. Bottom panel images from >0.6 mm PTC show mostly intact PNNs around PV neurons and high neuronal cell density (scale = 50 µm and 5 µm in large image and panel images, respectively) which are indistinguishable from sham (Supplementary Figure 1a-b). b WFA intensity within 0.0–0.2 mm (599.8 ± 80.84 au) and 0.2–0.4 mm (776.7 ± 134.8 au) PTC was significantly lower than sham (2315.0 ± 76.28 au) and contralateral (2012 ± 121.6 au). n = 6 mice. ****P < 0.0001, one-way ANOVA, Tukey’s post-hoc test. c Confocal images of two representative PV neurons showing disintegrated architecture in GBM22 PTC compared to sham. Scale = 2 µm. d WFA fluorescence intensity of a line drawn along the periphery of PV neuron in the PTC (left in c) and sham (right in c) showing many high-intensity WFA peaks in sham compared to the PTC. Upper and lower blue dotted lines represent the threshold WFA intensity (50% of the highest intensity) for the PTC and sham, respectively. Upper and lower red two-headed arrows within two nearest WFA peaks indicate the size of a hole in PNN from the PTC and sham, respectively. e Disintegrated PNNs in the PTC show significantly lower numbers of WFA intensity peaks (sham, 21.15 ± 0.92, n = 13 PNNs from four mice; PTC, 9.88 ± 0.84, n = 9 PNNs from three mice). **p < 0.01, unpaired t test. PTC in (d) and (e) represent 0–0.4 mm area

