Fig. 1.
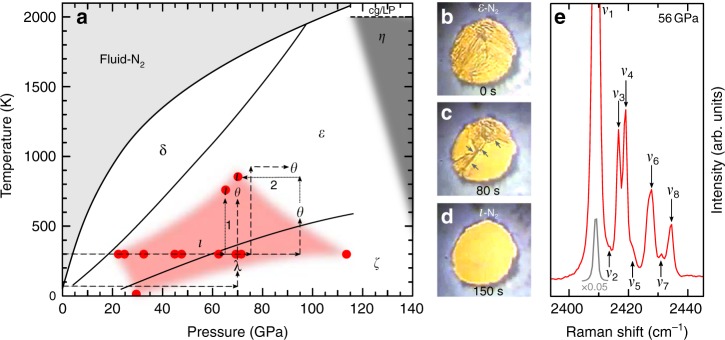
The nitrogen phase and reaction diagram. a The reported P–T paths to the high-temperature molecular phases ι–N2 and θ–N2 are shown with dotted and dashed arrows respectively. The red shaded region approximates the known stability field of ι–N2 based on a combination of our Raman measurements and those of ref.12. Path 1: Isobaric heating of ε–N2 to 750 K at 65 GPa, as performed in this study. Path 2: Isothermal decompression of θ–N2 to 69 GPa at 850 K. P–T paths and data points are taken from refs.11,12,21,22 which identify the phases through Raman spectroscopy. Black phase-boundaries are based on refs.21–23. Phases α, β, γ, δ*, ζ', κ and λ–N2 are omitted for clarity. b–d Micrographs of the visual changes across the ε–N2 → ι–N2 phase transition. The sample is approximately 60 μm in diameter and 15 μm thick. The time from the onset of the phase-transition is shown on each frame. The arrows in c indicate the progression of the ε–N2 → ι–N2 phase boundary. e Vibrational Raman spectrum of ι–N2 once recovered to ambient temperature. The inset spectrum (light grey) shows ν1 scaled by a factor of 0.05 to display it fully

