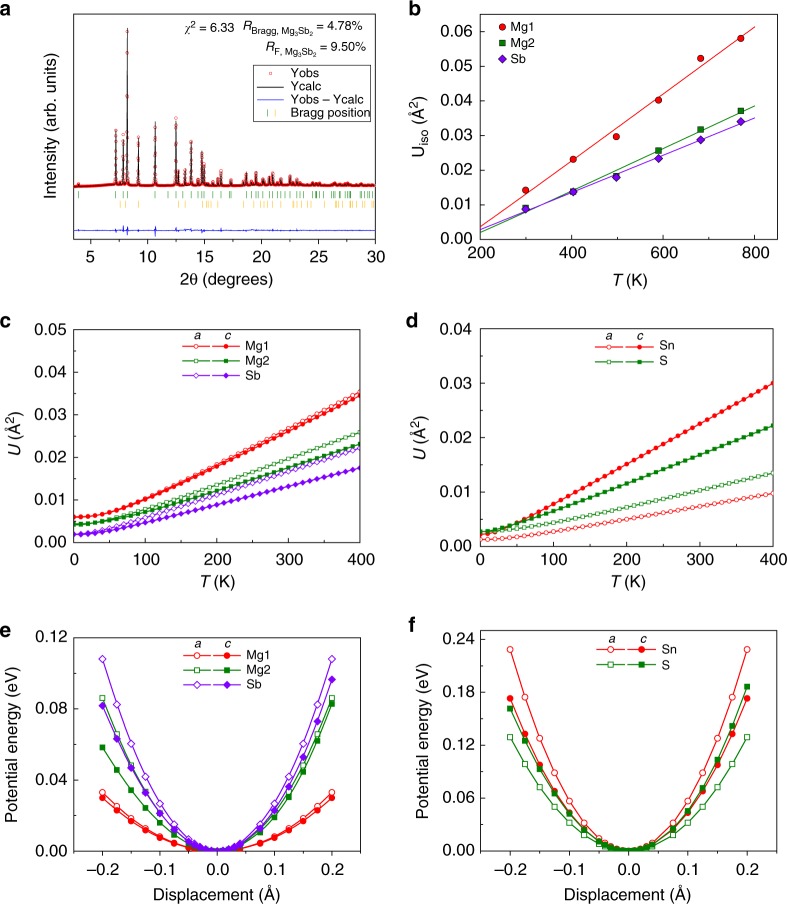
Fig. 4.
Atomic displacement parameters and potential energy curves. a Calculated (Rietveld method) and observed synchrotron PXRD patterns of Mg3Sb2 at 770 K upon cooling. Red open circles and black line are observed and calculated data, respectively. The blue line represents the difference between the observed and calculated patterns. The green and orange vertical bars correspond to the Bragg positions of the main phase Mg3Sb2 and the secondary phase Sb, respectively. b Temperature dependence of the experimental isotropic atomic displacement parameters of Mg3Sb2. c, d Temperature dependence of the theoretical atomic displacement parameters along different axial directions of (c) Mg3Sb2 and (d) SnS2. e, f The potential energy curves for the nonequivalent atoms of (e) Mg3Sb2 and (f) SnS2 as a function of the displacements from the equilibrium positions

