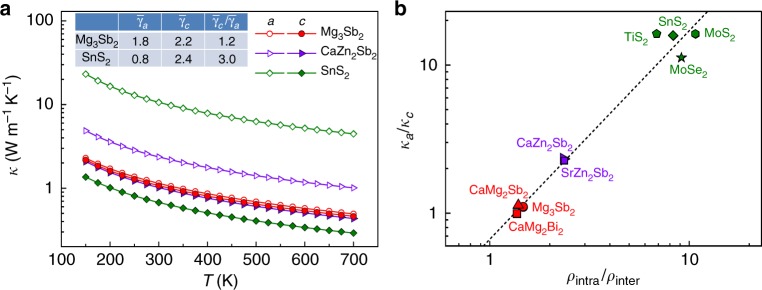
Fig. 5.
Lattice thermal conductivity. a Calculated lattice thermal conductivity of Mg3Sb2, CaZn2Sb2, and SnS2 along a and c directions as a function of temperature. The inset table displays the average Grüneisen parameters at room temperature along a and c directions. b Anisotropy of lattice thermal conductivity κa/κc at 300 K as a function of the intralayer-to-interlayer bond-strength ratio ρintra/ρinter. ρintra and ρinter represent the electron density values at BCPs of the intralayer and interlayer bonds, respectively. The theoretical lattice thermal conductivity data of MoSe2 and MoS2 are adapted from ref. 3. The dashed line is a guide to the eyes

