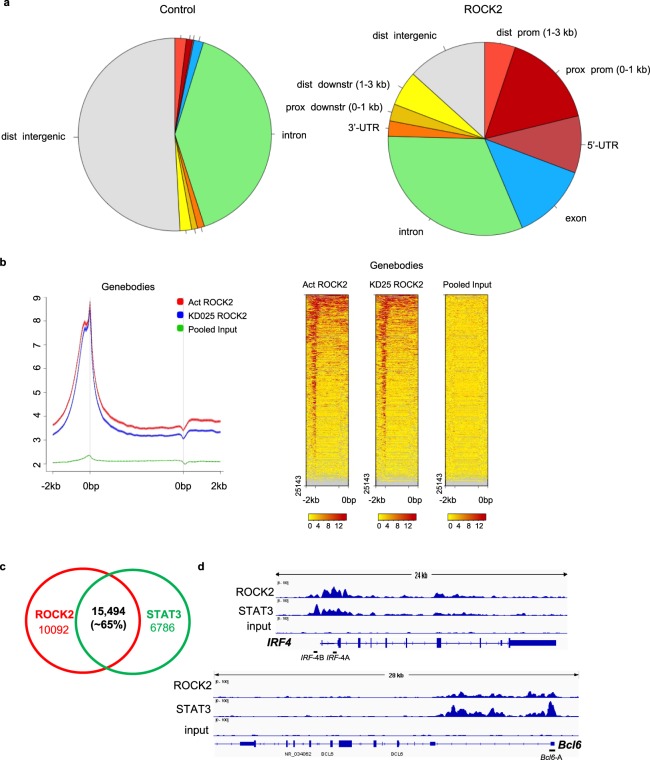
Figure 2.
ROCK2 and STAT3 ChIP-seq analysis of human T cell. Human peripheral blood CD4+ T cells were stimulated under TH17-skewing conditions for 48 hours; chromatin was purified and proceeded to ChIP-seq analysis with anti-ROCK2 or anti-STAT3 antibodies. (a) ROCK2 binding is enriched at genomic structures compared to control. Pie chart of ROCK2 active peaks distribution over control. (b) ROCK2 preferentially binds to transcription start sites. Metagene analysis of ROCK2 occupancy on an average gene (left) and Heat map of ChIP-seq reads for ROCK2 occupancy (right). (c) Venn diagram with numbers of genomic sites bound by ROCK2 and STAT3. (d) An integrative genomics viewer (IGV) browser representation of normalized ChIP-seq reads for ROCK2, STAT3 and input at the Irf4 and Bcl6 gene locus. Black bars (Irf4-A and Irf4-B, Bcl6-A) indicate primers used in the ChIP-qPCR analyses in Figs 3, 4.

