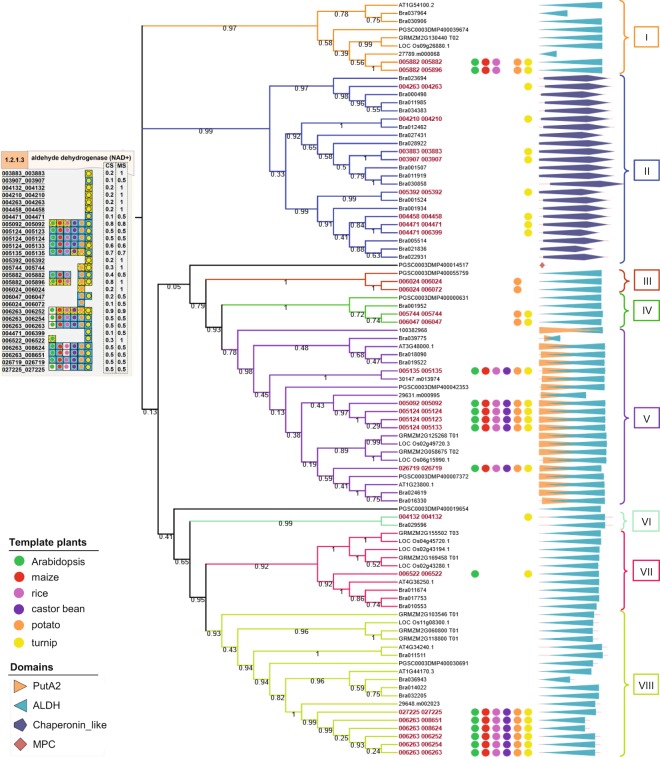
Figure 11.
The maximum likelihood (ML) tree and domain analysis among 28 amino acid sequences of cassava (red) annotated to aldehyde dehydrogenase (NAD+) (EC 1.2.1.3; ALDH) and amino acid sequences of template plants (black). The ML tree was reconstructed with Jones-Taylor-Thornton (JTT) amino acid substitution model. Bootstrap values were also applied with 100 replicates represented as percentage on the tree branches. The shapes and colors represent the domain families: Aldehyde-alcohol dehydrogenase (PutA2), Aldehyde dehydrogenase (ALDH), chaperonin like, and the uncharacterized protein family (MPC). The representative model plant species, marked as colored circles, were used to annotate each cassava protein. All of the ALDH proteins in cassava (MeRecon) was also visualized in SmartDraw platform (Top left).

