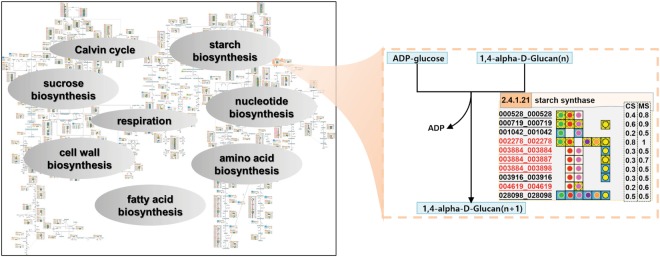
Figure 3.
The visualization of the reconstructed carbon assimilation pathway (MeRecon). The approach is based on Saithong et al.8, and the pathway shows the relationship of metabolites, enzymatic reactions, enzymes — represented as EC numbers, enzyme functions, and gene IDs and protein IDs — both IDs designated as 12-digits code. The red colored codes indicate annotated proteins that were supported by cloned sequences in GenBank, while underlined codes indicate those supported by expression datasets. The conservation score (CS) and match score (MS) indicate the confidence level of the annotated proteins. The template plants from which the relevant cassava proteins were annotated, are denoted by colored circles:  Arabidopsis,
  maize,
  rice,
rice,  castor bean,
  potato, and
  turnip. The color of background grids represents the quality gradient of sequence alignment: yellow – high value, blue – mid value, and white – low value.

