Figure 5.
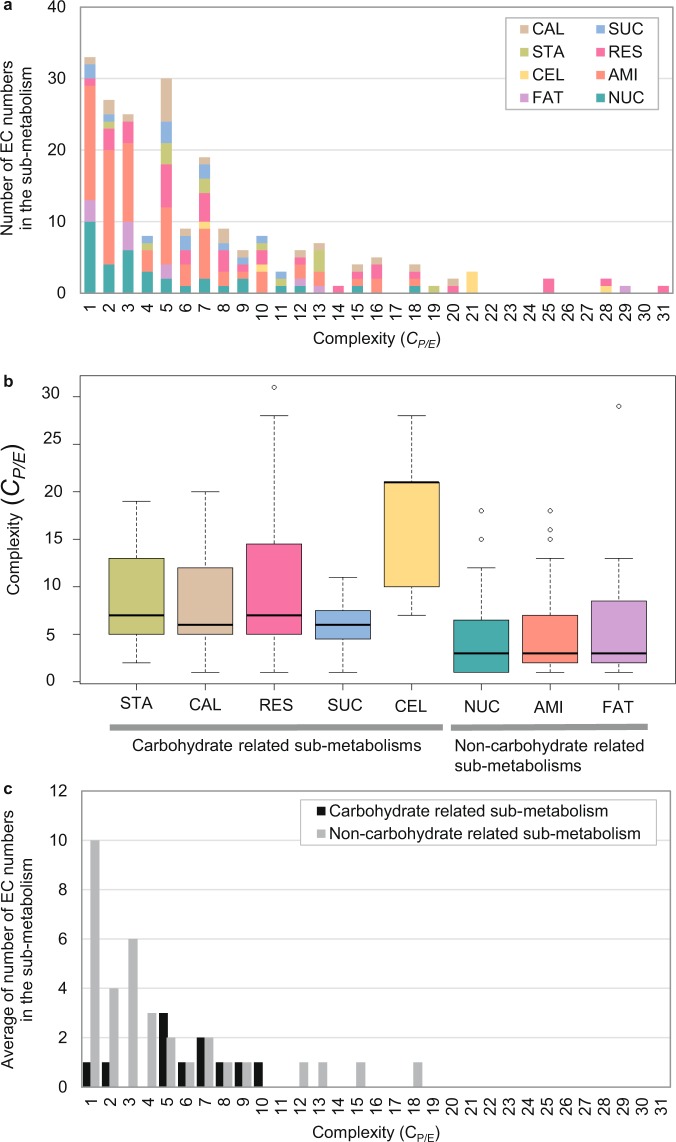
The complexity of the carbon assimilation metabolic pathway of cassava based on association of enzymatic proteins and metabolic enzymes. (a) The distribution of proteins annotated to an enzyme (Complexity: CP/E): CAL - Calvin cycle, SUC - sucrose biosynthesis, STA - starch biosynthesis, RES - respiration, AMI - amino acid biosynthesis, CEL - cell wall biosynthesis, FAT - fatty acid biosynthesis, and NUC - nucleotide biosynthesis; (b) Box-plot of Complexity (CP/E) determined from each sub-metabolism; (c) Complexity (CP/E) of carbohydrate-related sub-metabolisms (black bar: STA, CAL, RES, SUC, and CEL) and non-carbohydrate-related sub-metabolisms (gray bar: NUC, AMI, and FAT) calculated based on the average CP/E value of enzymes in the pathway.

